Sensitivity and specificity are statistical measures used to evaluate the performance of diagnostic tests or screening tools in medicine and other fields. ### Sensitivity - **Definition**: Sensitivity refers to the ability of a test to correctly identify individuals who have a particular disease or condition. It measures the proportion of true positives (correctly identified cases) out of the total number of actual positives (both true positives and false negatives).
Smash Childhood Cancer is an initiative aimed at raising awareness and funds for research and treatment of pediatric cancer. This campaign typically involves various activities, events, and collaborations aimed at supporting children diagnosed with cancer and their families. It often focuses on funding innovative research to improve treatment options and outcomes for these young patients.
Chess openings refer to the initial moves of a chess game, typically covering the first 10 to 20 moves. The opening phase is crucial because it sets the stage for the middlegame, determining the structure of the position, piece activity, and potential strategies. Chess openings have been extensively studied and categorized into various systems and variations, each with its own strategies and plans. Openings are generally classified into several categories: 1. **Open Games (1.
Chess strategy refers to the long-term planning and decision-making processes that players use to gain advantages over their opponents. Unlike tactics, which focus on short-term sequences of moves and immediate threats (like forks or discovered attacks), strategy encompasses broader themes and concepts that guide a player's overall approach to the game.
The Wiener index is a topological descriptor used in the field of graph theory and cheminformatics to measure the connectivity of a chemical graph. Specifically, it is defined as the sum of the shortest path lengths between all pairs of vertices in the graph. The Wiener index is often denoted as \( W(G) \), where \( G \) is the graph in question.
Chess endgame literature refers to books, articles, and other written resources that focus specifically on the study and understanding of the endgame phase of chess games. The endgame is the final stage of a chess match, characterized by a reduced number of pieces on the board. Mastery of endgames is crucial for players to convert advantages into wins or salvage draws from inferior positions.
The chess middlegame is the phase of a chess game that follows the opening and precedes the endgame. It is characterized by a more complex and dynamic position where players maneuver their pieces to improve their positions, create threats, and prepare for the endgame. Key features of the middlegame include: 1. **Piece Development**: Players focus on activating their pieces, controlling key squares, and coordinating their pieces effectively.
The "king and pawn versus king" endgame is a fundamental endgame scenario in chess. It occurs when one player has a single pawn and their king, while the opponent only has a king and no pawns. The outcome of this endgame typically depends on the position of the pieces on the board and whether the player with the pawn can promote it to a queen or another piece.
Chess traps are specific sequences of moves that aim to take advantage of an opponent's mistakes or oversights early in the game, often leading to a quick advantage, material gain, or even checkmate. They are typically employed in the opening phase of the game and can occur in various openings or setups.
Chess is a strategic board game played between two players. The rules of chess outline how the game is played, how pieces move, and how games are won or drawn. Here are the fundamental rules of chess: ### The Chessboard - The game is played on an 8x8 square board, alternating light and dark squares. - Each player begins with 16 pieces: one king, one queen, two rooks, two knights, two bishops, and eight pawns.
In chess, "tempo" refers to the concept of time and move efficiency in the game. Each turn in chess is considered a unit of tempo, and gaining a tempo means taking an action that forces your opponent to respond in a way that is less advantageous for them or to spend their turn reacting instead of developing their own plan.
Triangulation in chess is a strategic maneuver used primarily in endgame situations. It involves a player making a series of moves that return their king (or sometimes another piece) to the same position while forcing the opponent to move into a less favorable position. The main purpose of triangulation is to gain the opposition—meaning to place the opponent's king in a position where it is out of squares to move to, thus giving the moving player a strategic advantage.
"Checkmate" is a term commonly used in chess, denoting a situation where a player's king is in a position to be captured ("in check") and there are no legal moves available to remove the threat of capture. When a player announces "checkmate," it signifies the end of the game, with that player being the victor.
"Corresponding squares" could refer to different concepts depending on the context in which it is used. Here are a few possible interpretations: 1. **Mathematics**: In geometry, corresponding squares may refer to squares that occupy equivalent positions in different geometric shapes or configurations. For example, in a geometric transformation, corresponding squares might be those that map from one shape to another.
In chess, a "decoy" is a tactical concept where a player uses a piece to lure an opponent's piece to a less favorable square. The idea is to create a distraction or temptation that leads to a favorable outcome for the player initiating the decoy. The purpose of this tactic can vary, but it typically aims to expose weaknesses in the opponent's position, facilitate an attack, or improve the player's overall position.
Zdzisław Bubnicki is a notable Polish mathematician known for his contributions in the field of topology and functional analysis. He has authored and co-authored various mathematical papers and works throughout his career.
Huygens is a prominent impact crater located on the Moon's surface in the southern hemisphere, specifically in the region known as the Oceanus Procellarum, or the Ocean of Storms. The crater is named after the Dutch astronomer Christiaan Huygens, who made significant contributions to the study of astronomy in the 17th century. The diameter of Huygens is approximately 110 kilometers (about 68 miles), making it a relatively large feature.
A list of chess traps refers to specific sequences of moves in chess that can lead to a quick victory or significant advantage for one player, often at the cost of their opponent's blunders or oversights. These traps usually arise from common openings and can catch players off guard, particularly those who are less experienced. Here are some well-known chess traps: 1. **Fried Liver Attack** (Italian Game) - Occurs when Black plays 5...
In chess, "opposition" refers to a specific positioning of the kings in the endgame, particularly in king-and-pawn endgames. It occurs when two kings are on the same rank, file, or diagonal with an odd number of squares between them, meaning one king is directly in front of the other. The player who does not have to move generally has the advantage.
Pinned article: Introduction to the OurBigBook Project
Welcome to the OurBigBook Project! Our goal is to create the perfect publishing platform for STEM subjects, and get university-level students to write the best free STEM tutorials ever.
Everyone is welcome to create an account and play with the site: ourbigbook.com/go/register. We belive that students themselves can write amazing tutorials, but teachers are welcome too. You can write about anything you want, it doesn't have to be STEM or even educational. Silly test content is very welcome and you won't be penalized in any way. Just keep it legal!
Intro to OurBigBook
. Source. We have two killer features:
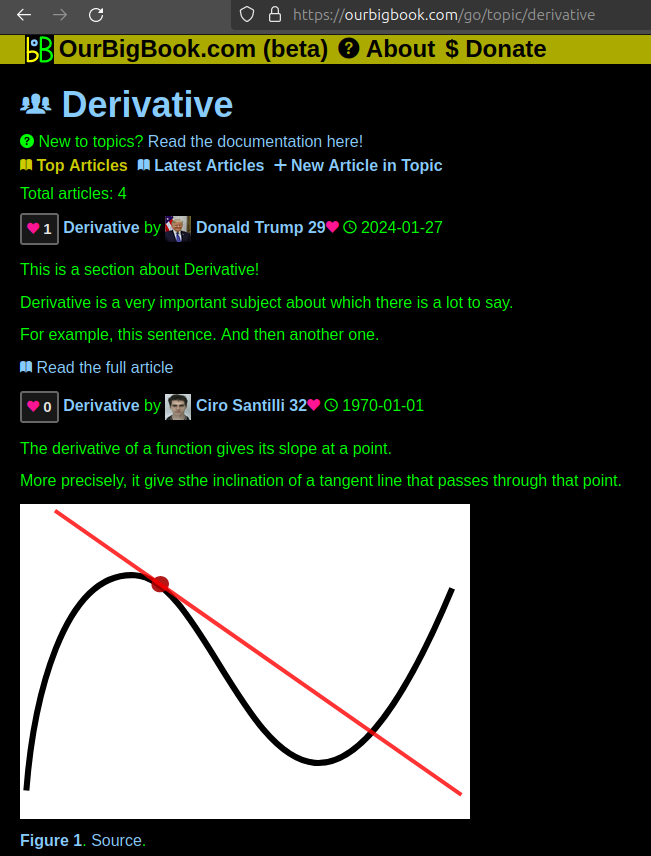
- topics: topics group articles by different users with the same title, e.g. here is the topic for the "Fundamental Theorem of Calculus" ourbigbook.com/go/topic/fundamental-theorem-of-calculusArticles of different users are sorted by upvote within each article page. This feature is a bit like:
- a Wikipedia where each user can have their own version of each article
- a Q&A website like Stack Overflow, where multiple people can give their views on a given topic, and the best ones are sorted by upvote. Except you don't need to wait for someone to ask first, and any topic goes, no matter how narrow or broad
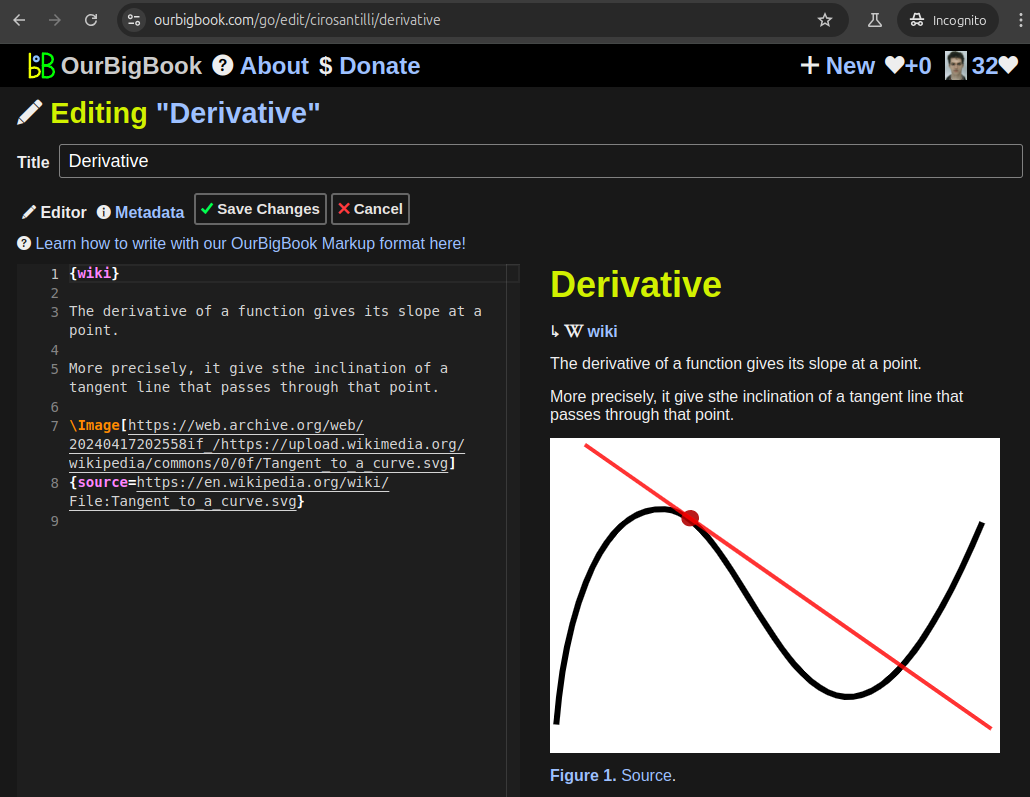
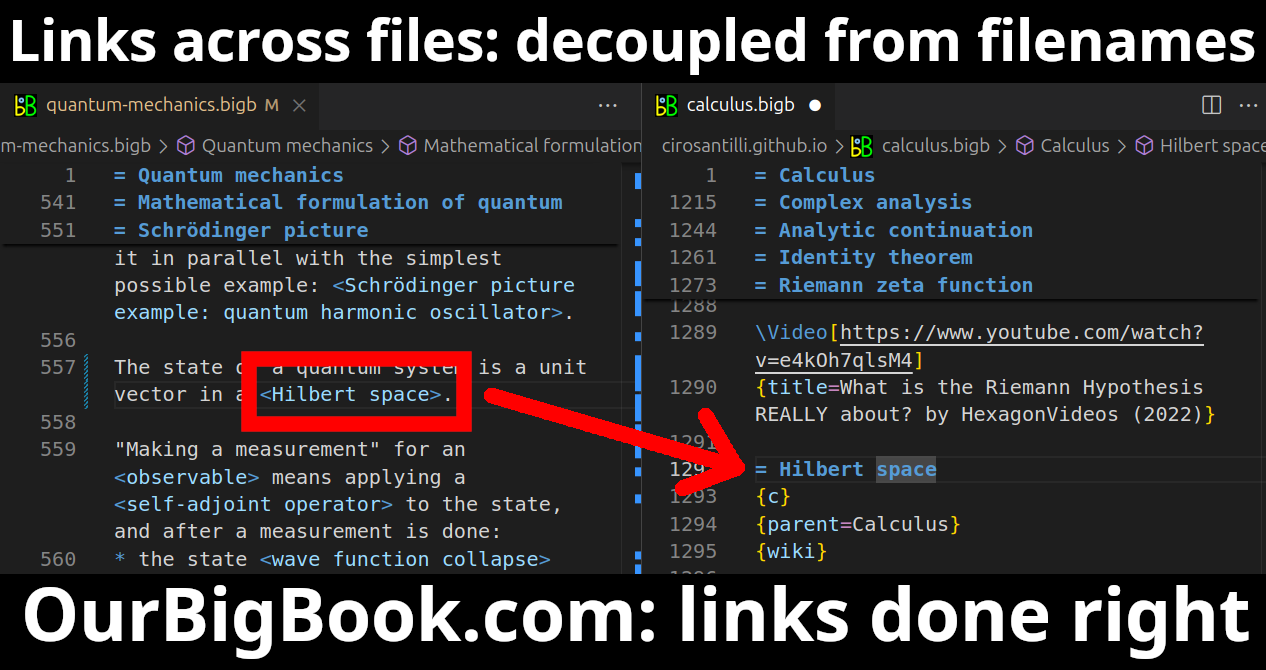
This feature makes it possible for readers to find better explanations of any topic created by other writers. And it allows writers to create an explanation in a place that readers might actually find it.Figure 1. Screenshot of the "Derivative" topic page. View it live at: ourbigbook.com/go/topic/derivativeVideo 2. OurBigBook Web topics demo. Source. - local editing: you can store all your personal knowledge base content locally in a plaintext markup format that can be edited locally and published either:This way you can be sure that even if OurBigBook.com were to go down one day (which we have no plans to do as it is quite cheap to host!), your content will still be perfectly readable as a static site.
- to OurBigBook.com to get awesome multi-user features like topics and likes
- as HTML files to a static website, which you can host yourself for free on many external providers like GitHub Pages, and remain in full control
Figure 2. You can publish local OurBigBook lightweight markup files to either OurBigBook.com or as a static website.Figure 3. Visual Studio Code extension installation.Figure 5. . You can also edit articles on the Web editor without installing anything locally. Video 3. Edit locally and publish demo. Source. This shows editing OurBigBook Markup and publishing it using the Visual Studio Code extension. - Infinitely deep tables of contents:
All our software is open source and hosted at: github.com/ourbigbook/ourbigbook
Further documentation can be found at: docs.ourbigbook.com
Feel free to reach our to us for any help or suggestions: docs.ourbigbook.com/#contact


