In fiction, "stasis" refers to a state of equilibrium or balance in a storyline, where characters and their circumstances are relatively unchanging or static. This concept is often used to set the stage for a story, providing a baseline for how things are before a conflict or significant change disrupts the status quo.
"Time" is a British television drama series that premiered on BBC One in June 2021. Created by Jimmy McGovern, the show stars Sean Bean as Mark Cobden, a teacher who is sentenced to prison for a driving offense that resulted in the death of an innocent man. The series explores the harsh realities of prison life and the impact of incarceration on individuals and their families. The storyline delves into themes of guilt, redemption, and the struggles that come with navigating the criminal justice system.
"Battlefield Earth" is a science fiction novel written by L. Ron Hubbard, published in 1982. The story is set in a post-apocalyptic Earth, which has been under the control of an alien race known as the Psychlos for about a thousand years. The novel follows the character Jonnie Goodboy Tyler, a human who rises up against the oppressive alien regime to free humanity.
Narbacular Drop is a puzzle-platform video game developed by a team of students at DigiPen Institute of Technology in 2005. It is notable for being a precursor to the more widely known game Portal, which was later developed by Valve. In Narbacular Drop, players control a character who has the unique ability to create portals on flat surfaces, allowing them to navigate through a series of puzzles and levels.
"Space" is a science fiction novel written by the author James A. Gardner. It is part of the "Baxter" series, which explores themes of space exploration, the nature of humanity, and the potential futures of technology and society. The narrative often involves complex scientific concepts and philosophical questions, reflecting Gardner's background in both writing and the sciences.
"The Last Continent" is a fantasy novel written by British author Terry Pratchett, published in 1998. It is part of his Discworld series and is the 22nd book in the series. The story follows Rincewind, a inept and cowardly wizard, as he finds himself on a continent that appears to be a parody of Australia, featuring various elements of Australian culture and wildlife.
"The Stars My Destination" is a science fiction novel by Alfred Bester, first published in 1956. The story is set in a future where humans have developed the ability to "jaunte," a form of teleportation that allows individuals to transport themselves instantaneously over distances. The plot follows Gully Foyle, a common man who is stranded in space after his ship is attacked and left to die.
In the Star Trek universe, a transporter is a advanced technology that allows for the instantaneous transfer of matter, particularly people and objects, from one location to another. The most common use of the transporter is to "beam" crew members and equipment from a starship to a planetary surface or between ships, effectively dematerializing them at one location and rematerializing them at another.
Semiconductor Science and Technology is a multidisciplinary field that encompasses the study and application of semiconductors, materials that have electrical conductivity between that of conductors (like metals) and insulators (like glass). This field integrates principles from physics, materials science, electrical engineering, and chemistry to explore the properties and applications of semiconductor materials and devices.
Space Science Reviews is a scientific journal that publishes comprehensive, high-quality review articles covering a wide range of topics in space science. It serves as a platform for researchers and experts in the field to present the latest developments, findings, and theories related to space exploration, astrophysics, planetary science, cosmology, and related areas. The journal aims to provide a well-rounded overview of current research trends and advancements, making it a valuable resource for scientists, researchers, and students interested in space science.
Integrationism is a concept that can apply to different fields, but it generally refers to the process or ideology of integrating separate components into a unified whole. These are some contexts where integrationism might be relevant: 1. **Sociocultural Integrationism**: This typically involves the integration of diverse cultural groups within a society, emphasizing the importance of social cohesion and the benefits of mutual respect and understanding among different communities.
A computable number is a real number that can be calculated to any desired degree of precision by a finite, deterministic procedure, such as a computer algorithm or a mathematical process. In other words, a computable number is one for which there exists a method (or algorithm) that can produce its digits when given enough time and resources.
The Deflationary Theory of Truth is a philosophical perspective that downplays the significance of the concept of truth. Rather than viewing truth as a substantial property that sentences possess, deflationists argue that the notion of truth can be expressed in a simplified or trivial way. One of the key ideas behind deflationary theories is that asserting that a statement is true does not provide any additional information beyond the statement itself.
Pluralist theories of truth propose that there is not a single, exclusive conception of truth but rather multiple ways of understanding or defining truth that can be valid depending on the context. This perspective acknowledges that different domains of inquiry may require different standards of truth, and thus what is considered true in one context may not apply in another.
The Redundancy Theory of Truth is a philosophical position concerning the nature of truth, primarily associated with the work of philosophers such as Frank P. Ramsey and later developed by others like Paul Horwich. This theory asserts that the concept of truth is redundant and that the predicate "is true" does not add any new information to the propositions it is applied to. Instead, the theory claims that truth can be expressed by simply asserting the proposition itself.
The Ackermann function is a well-known example of a recursive function that is not primitive recursive. It serves as a benchmark for computing and illustrates the concept of deep recursion.
"Tube sound" refers to the characteristic audio quality produced by vacuum tube amplifiers, widely used in music production and amplification, particularly in electric guitars and high-fidelity audio systems. Tube amplifiers use vacuum tubes (also known as thermionic valves) to amplify audio signals, and they are known for creating a warm, rich, and pleasing sound.
Pinned article: Introduction to the OurBigBook Project
Welcome to the OurBigBook Project! Our goal is to create the perfect publishing platform for STEM subjects, and get university-level students to write the best free STEM tutorials ever.
Everyone is welcome to create an account and play with the site: ourbigbook.com/go/register. We belive that students themselves can write amazing tutorials, but teachers are welcome too. You can write about anything you want, it doesn't have to be STEM or even educational. Silly test content is very welcome and you won't be penalized in any way. Just keep it legal!
Intro to OurBigBook
. Source. We have two killer features:
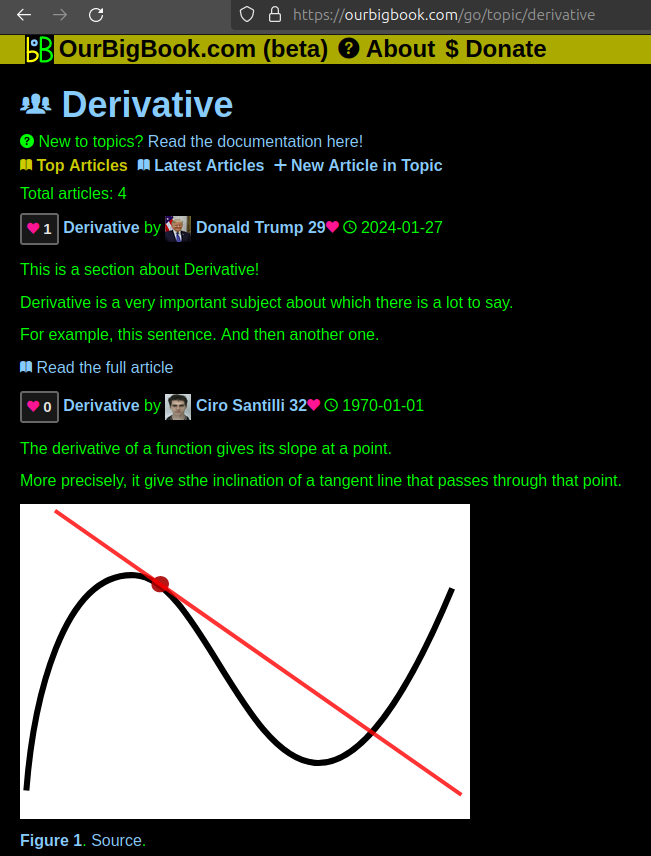
- topics: topics group articles by different users with the same title, e.g. here is the topic for the "Fundamental Theorem of Calculus" ourbigbook.com/go/topic/fundamental-theorem-of-calculusArticles of different users are sorted by upvote within each article page. This feature is a bit like:
- a Wikipedia where each user can have their own version of each article
- a Q&A website like Stack Overflow, where multiple people can give their views on a given topic, and the best ones are sorted by upvote. Except you don't need to wait for someone to ask first, and any topic goes, no matter how narrow or broad
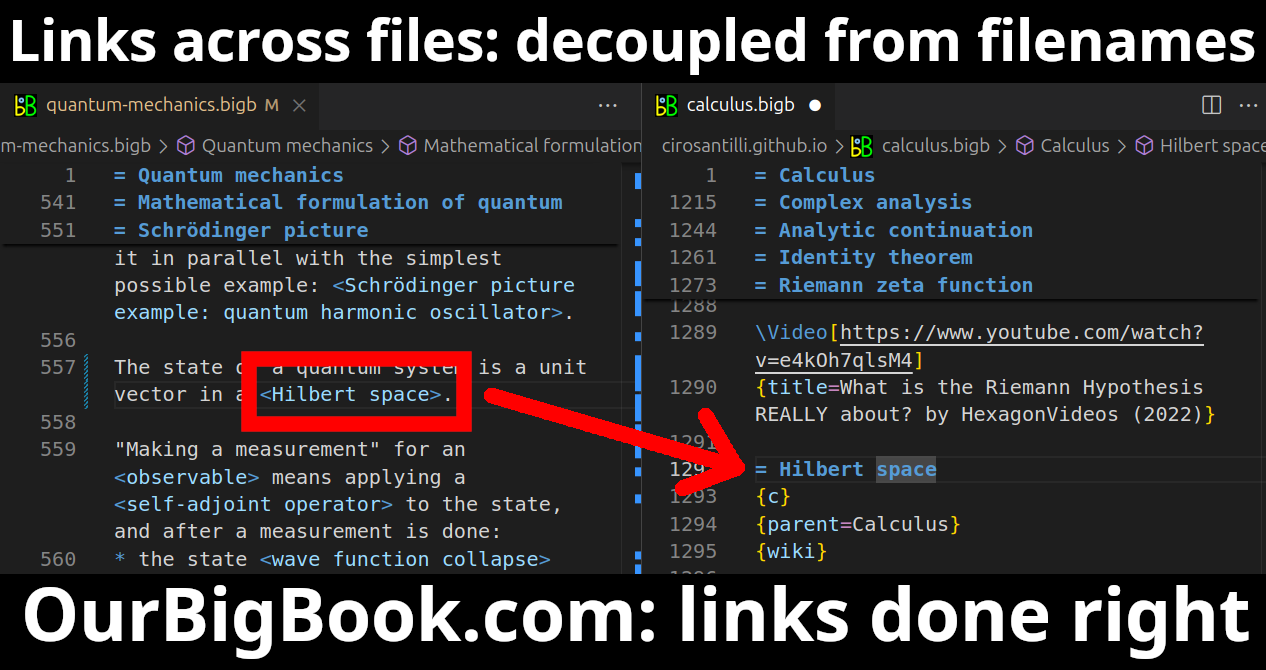
This feature makes it possible for readers to find better explanations of any topic created by other writers. And it allows writers to create an explanation in a place that readers might actually find it.Figure 1. Screenshot of the "Derivative" topic page. View it live at: ourbigbook.com/go/topic/derivativeVideo 2. OurBigBook Web topics demo. Source. - local editing: you can store all your personal knowledge base content locally in a plaintext markup format that can be edited locally and published either:This way you can be sure that even if OurBigBook.com were to go down one day (which we have no plans to do as it is quite cheap to host!), your content will still be perfectly readable as a static site.
- to OurBigBook.com to get awesome multi-user features like topics and likes
- as HTML files to a static website, which you can host yourself for free on many external providers like GitHub Pages, and remain in full control
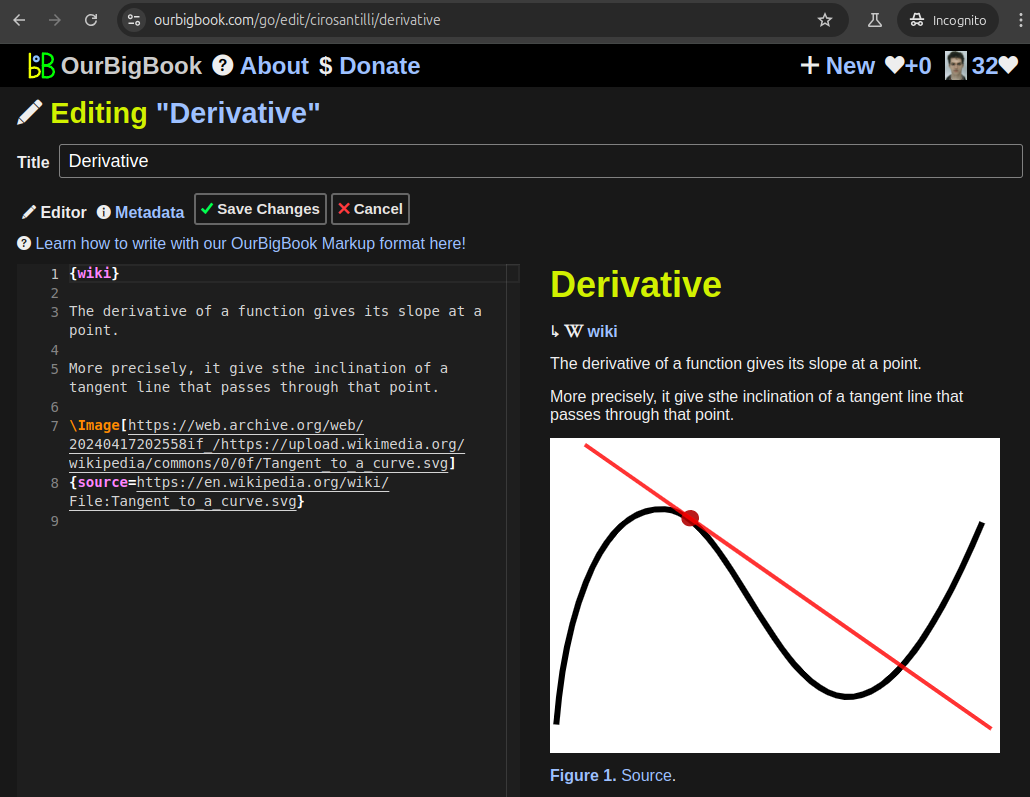
Figure 3. Visual Studio Code extension installation.Figure 4. Visual Studio Code extension tree navigation.Figure 5. Web editor. You can also edit articles on the Web editor without installing anything locally.Video 3. Edit locally and publish demo. Source. This shows editing OurBigBook Markup and publishing it using the Visual Studio Code extension.Video 4. OurBigBook Visual Studio Code extension editing and navigation demo. Source. - Infinitely deep tables of contents:
All our software is open source and hosted at: github.com/ourbigbook/ourbigbook
Further documentation can be found at: docs.ourbigbook.com
Feel free to reach our to us for any help or suggestions: docs.ourbigbook.com/#contact


