"Snow" in Louisiana can refer to several different concepts depending on context. Most commonly, it refers to the rare instances of snowfall that occur in the state, especially in the northern regions where temperatures can drop low enough during winter months for snow to form. Snow in Louisiana is generally infrequent and tends to be light when it does occur, given the state's overall warm climate.
Martin King is a broadcaster and television personality from Ireland, known primarily for his work on various television programs, especially in the realm of entertainment and sports. He has presented and reported on a range of shows, including those related to Irish culture, current affairs, and lifestyle. King is recognized for his engaging style and has built a reputation over the years in the broadcasting industry.
Tiffany Shaw may refer to different entities or people, but without specific context, it's difficult to provide a precise answer.
Sam Champion is a well-known American television meteorologist and weather anchor. He gained prominence as the weather anchor for ABC's "Good Morning America," where he worked for many years. Champion's engaging personality and ability to present complex weather information in an accessible way contributed to his popularity. In addition to his work with ABC, Champion has been involved in various other media projects, including hosting and contributing to weather-related programming.
Lists of weather records typically refer to documented extremes and notable weather events that have occurred for specific locations or globally. These records can include a variety of weather phenomena such as: 1. **Temperature Extremes**: - Highest and lowest recorded temperatures in various areas. - Records for hottest and coldest weeks, months, or years. 2. **Precipitation Records**: - Highest rainfall amounts recorded in a day, month, or year.
A "list of ice storms" generally refers to documented events of significant ice storms that have affected various regions, particularly those where freezing rain and ice accumulation have caused widespread damage, power outages, and hazardous conditions. These lists are typically organized by date and may include details such as the regions impacted, the severity of the storm, and the aftermath.
A subtropical climate is characterized by hot, humid summers and mild winters. There are two main types of subtropical climates: humid subtropical and dry-summer subtropical (Mediterranean). Here is a list of regions and locations that typically exhibit subtropical climates: ### Humid Subtropical Climate: 1. **Southeastern United States** - Areas include parts of Florida, Georgia, Alabama, Mississippi, Louisiana, South Carolina, North Carolina, and Texas.
Laser-guided and stabilized arc welding is a welding technique that combines traditional arc welding methods with laser technology to enhance the precision, control, and efficiency of the welding process. Here’s a breakdown of the key components of this technique: ### Key Components 1. **Arc Welding**: This is a process that uses an electric arc to generate heat for melting and fusing materials, typically metals.
The weather of 2022 was characterized by several significant global climate events. Here are some notable highlights: 1. **Extreme Heat**: Many regions experienced record-breaking heatwaves. Europe, particularly, faced severe heat in the summer, with countries like the UK and Spain recording unprecedented high temperatures. 2. **Drought**: Prolonged drought conditions affected areas in the southwestern United States, parts of Europe, and East Africa.
Jsoup is a Java library designed for working with real-world HTML. It provides a convenient API for extracting and manipulating data from HTML documents, making it useful for tasks such as web scraping, parsing HTML, and cleaning up malformed content. Key features of Jsoup include: 1. **HTML Parsing**: Jsoup can parse HTML from various sources such as URLs, files, or strings, turning them into a Document object that you can manipulate.
Friction Stir Welding (FSW) is a solid-state joining process that uses a specially designed rotating tool to create frictional heat between two workpieces, which are then fused together as the tool moves along the joint. This process is particularly beneficial for joining materials that are difficult to weld using conventional methods, such as aluminum alloys and certain plastics. **Friction Stir Welding Experts** are individuals or professionals who specialize in the study, development, and application of FSW technology.
Search engine scraping, often referred to as web scraping, is the process of automated data extraction from search engine results pages (SERPs). This technique is commonly used to collect information such as: 1. **Search Results**: Gathering URLs, titles, and descriptions of webpages that appear in response to specific search queries. 2. **Rank Tracking**: Monitoring the position of a website for particular keywords over time to analyze SEO performance.
UBot Studio is a software application designed for creating automated bots and web automation tools without the need for extensive programming knowledge. It allows users to automate repetitive tasks, scrape data from websites, and interact with web applications. UBot Studio features a user-friendly drag-and-drop interface, enabling users to create bots visually, while also offering scripting capabilities for more advanced users.
Welding safety refers to the practices and precautions taken to protect welders and others from hazards associated with welding processes. Welding, which involves joining materials through the application of heat, can pose various risks, including exposure to harmful fumes, burns, electrical shock, fire, and eye injuries. Here are some key aspects of welding safety: 1. **Personal Protective Equipment (PPE):** - **Welding Helmet:** Protects the eyes and face from intense light, heat, and sparks.
Pattern welding is a traditional method of forging and shaping metal, particularly steel, that involves layering different types of iron and steel to create a distinctive, visually appealing pattern. This technique has historical significance and is most famously associated with the creation of beautiful and functional blades for weapons, such as swords and axes, particularly in the Viking Age and the production of Damascus steel. The process involves welding together multiple bars of ferrous metals with varying carbon content and properties.
The heat-affected zone (HAZ) is a region in the base material of a workpiece that has been thermally impacted by welding, cutting, or other processes involving heat. While the material in the HAZ has not melted, it has been subjected to temperatures high enough to alter its microstructure and mechanical properties.
Edward Emerson Barnard (1857-1923) was an American astronomer and astrophotographer known for his significant contributions to the field of astronomy, particularly in the study of comets and the Milky Way. He is perhaps best known for discovering several comets, including Barnard's Comet (1889), and for his work in photographing the Milky Way, which provided valuable insights into its structure and composition.
Lewis Evans is a mathematician known for his contributions to the field of mathematics, particularly in areas such as analysis and PDE (partial differential equations). He has made significant advancements in understanding nonlinear phenomena and has authored various papers and texts on these subjects. His work is influential in the mathematical community and often intersects with topics in applied mathematics, physics, and engineering.
In welding, an "undercut" refers to a defect that occurs when the base metal is melted away at the edges of the weld joint during the welding process, resulting in a groove or notch. This can happen if the weld pool is too hot or if there is improper control of the welding parameters. The undercut can compromise the structural integrity of the joint by creating a weak spot that may lead to failure under stress or load.
Pinned article: Introduction to the OurBigBook Project
Welcome to the OurBigBook Project! Our goal is to create the perfect publishing platform for STEM subjects, and get university-level students to write the best free STEM tutorials ever.
Everyone is welcome to create an account and play with the site: ourbigbook.com/go/register. We belive that students themselves can write amazing tutorials, but teachers are welcome too. You can write about anything you want, it doesn't have to be STEM or even educational. Silly test content is very welcome and you won't be penalized in any way. Just keep it legal!
Intro to OurBigBook
. Source. We have two killer features:
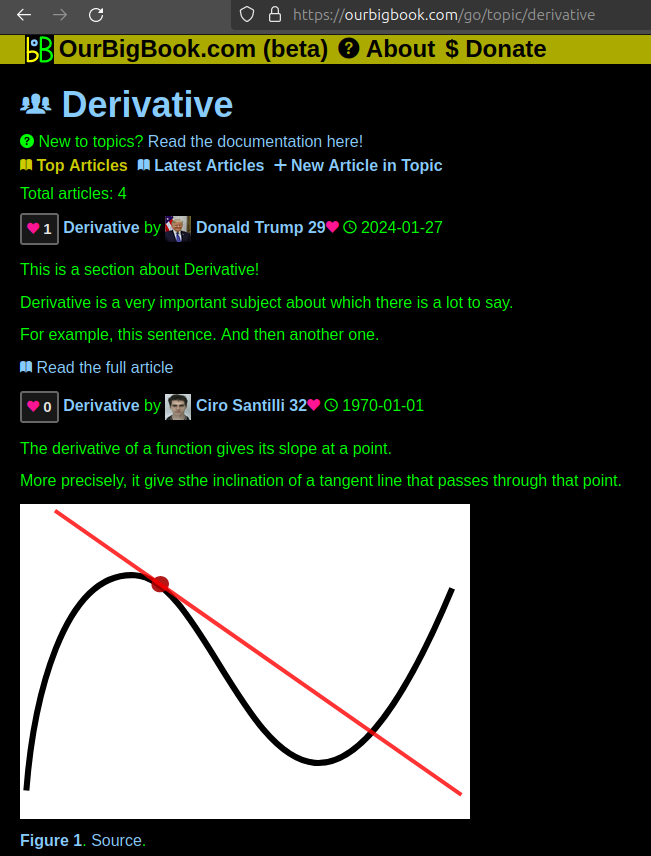
- topics: topics group articles by different users with the same title, e.g. here is the topic for the "Fundamental Theorem of Calculus" ourbigbook.com/go/topic/fundamental-theorem-of-calculusArticles of different users are sorted by upvote within each article page. This feature is a bit like:
- a Wikipedia where each user can have their own version of each article
- a Q&A website like Stack Overflow, where multiple people can give their views on a given topic, and the best ones are sorted by upvote. Except you don't need to wait for someone to ask first, and any topic goes, no matter how narrow or broad
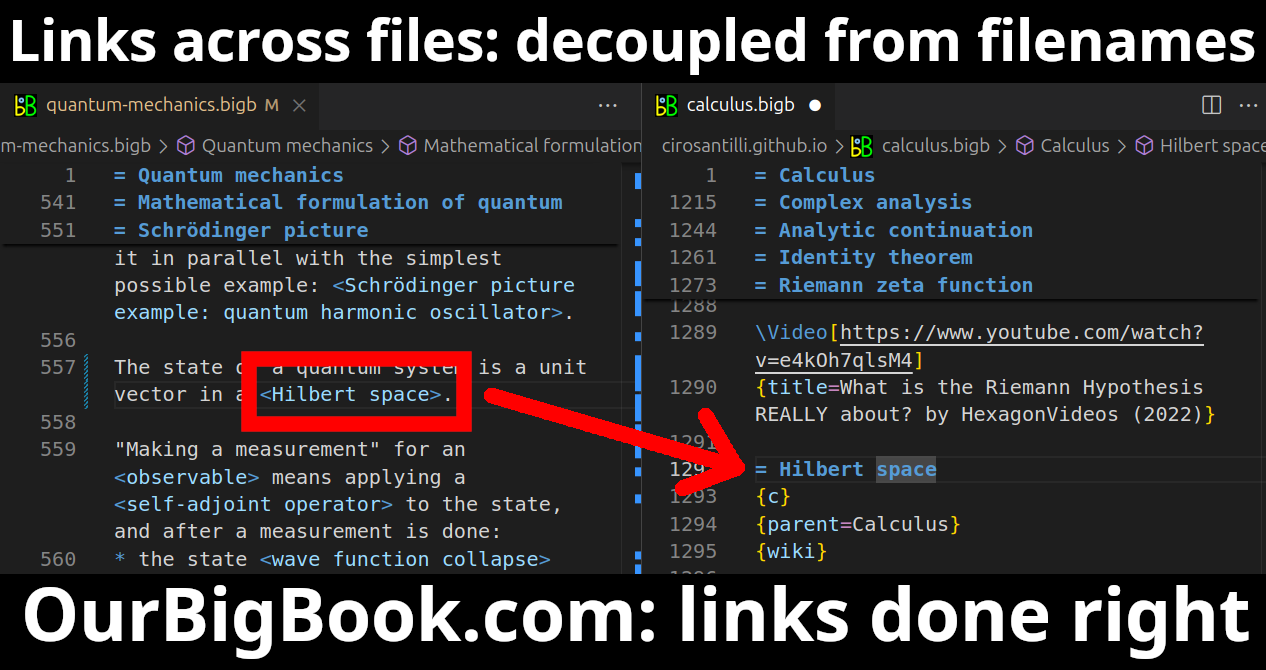
This feature makes it possible for readers to find better explanations of any topic created by other writers. And it allows writers to create an explanation in a place that readers might actually find it.Figure 1. Screenshot of the "Derivative" topic page. View it live at: ourbigbook.com/go/topic/derivativeVideo 2. OurBigBook Web topics demo. Source. - local editing: you can store all your personal knowledge base content locally in a plaintext markup format that can be edited locally and published either:This way you can be sure that even if OurBigBook.com were to go down one day (which we have no plans to do as it is quite cheap to host!), your content will still be perfectly readable as a static site.
- to OurBigBook.com to get awesome multi-user features like topics and likes
- as HTML files to a static website, which you can host yourself for free on many external providers like GitHub Pages, and remain in full control
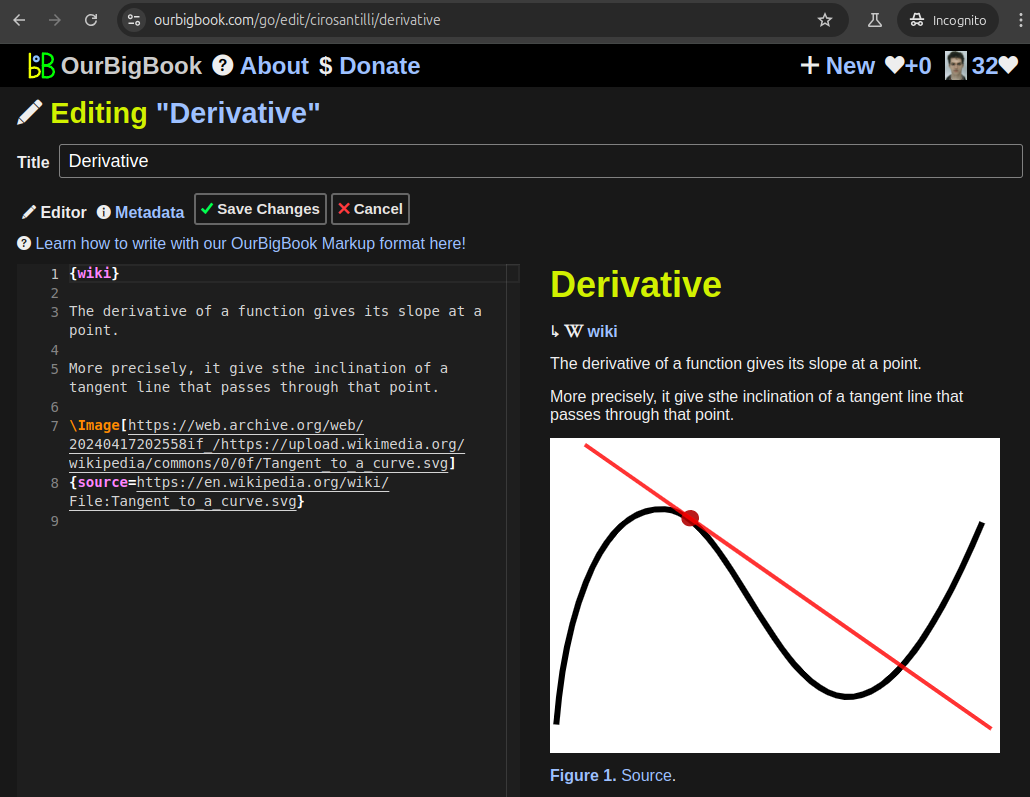
Figure 3. Visual Studio Code extension installation.Figure 4. Visual Studio Code extension tree navigation.Figure 5. Web editor. You can also edit articles on the Web editor without installing anything locally.Video 3. Edit locally and publish demo. Source. This shows editing OurBigBook Markup and publishing it using the Visual Studio Code extension.Video 4. OurBigBook Visual Studio Code extension editing and navigation demo. Source. - Infinitely deep tables of contents:
All our software is open source and hosted at: github.com/ourbigbook/ourbigbook
Further documentation can be found at: docs.ourbigbook.com
Feel free to reach our to us for any help or suggestions: docs.ourbigbook.com/#contact


