Michael Heath is a computer scientist known for his contributions to numerical analysis and high-performance computing. He has worked extensively on topics such as numerical linear algebra, parallel algorithms, and scientific computing. Heath is also recognized for his involvement in educational efforts in computer science and engineering, often focusing on the integration of numerical methods with computational techniques. In addition to his research, he has authored or co-authored numerous publications and has contributed to the development of software libraries for scientific computing.
Paul Rabinowitz is not a widely recognized figure in popular culture, academia, or news as of my last update in October 2023. If you have a specific context or field in mind (like literature, science, or another area), please provide more details so I can assist you better. Otherwise, it may be possible that he is a lesser-known individual or not in the public spotlight.
Michael Saunders is a prominent academic known for his contributions in the field of economics, particularly in the areas of monetary policy and macroeconomics. He has held various academic positions and is recognized for his research on economic models, central banking, and the implications of monetary policy on the economy. In addition to his academic roles, Saunders has also served as an advisor or consultant to various economic institutions and has contributed to policy discussions surrounding economic issues.
Michael Waterman is a prominent figure in the fields of computer science and mathematics, particularly known for his contributions to computational biology and bioinformatics. He is recognized for his work on sequence alignment algorithms, which are essential for comparing DNA, RNA, and protein sequences. His influential textbook, "Introduction to Computational Biology: Maps, Sequences, and Genomes," has been widely used in academic courses on bioinformatics.
Michel Goemans is a mathematician known for his contributions to combinatorial optimization, mathematical programming, and related fields. He is particularly recognized for his work on approximation algorithms and graph theory. One of his notable contributions is the development of the Goemans-Williamson algorithm, which provides an efficient approximation algorithm for the Maximum Cut problem. Goemans' research has had a significant impact on both theoretical computer science and practical applications of optimization, and his work is widely cited in the field.
Miroslav Krstić is a name associated with a prominent mathematician and academic known for his work in control theory, specifically in the area of nonlinear systems. As of my last knowledge update in October 2023, he has contributed significantly to the field through research, publications, and teaching.
Monique Laurent is a prominent French mathematician known for her contributions to fields such as optimization, operations research, and applied mathematics. She has particularly worked on topics related to convex and combinatorial optimization, and she has made significant contributions to the study of polynomial optimization. Laurent has been involved in research on various mathematical problems, including those related to semidefinite programming and the study of non-linear optimization problems.
Murray Rosenblatt is a prominent American mathematician known for his contributions to probability theory and statistics. He is particularly renowned for his work on stochastic processes, the theory of random walks, and for developing the Rosenblatt process, which is a type of stochastic process. His research has had a significant impact on various areas of applied mathematics, including time series analysis and the study of non-parametric statistics.
Nancy K. Nichols could refer to several individuals or entities, but without more context, it's not possible to provide a specific answer. If you are referring to a person, she might be a public figure, author, academic, or professional in a particular field. If you are looking for a company, organization, or another entity named Nancy K. Nichols, additional details would help clarify your request.
Nicholas J. Higham is a prominent mathematician known for his contributions to numerical linear algebra, particularly in matrix computations and analysis. He has authored several influential books and research papers in the field. Higham is also recognized for his work on topics such as rounding errors, matrix factorizations, and algorithms for numerical linear algebra. In addition to his research, Higham is a professor at the University of Manchester, where he teaches and supervises graduate students.
Nick Trefethen is a prominent mathematician known for his work in numerical analysis and scientific computing. He is particularly noted for his contributions to the fields of numerical linear algebra, approximation theory, and the development of computational methods for solving mathematical problems. Trefethen has authored several influential books and papers, including works on spectral methods for differential equations and the importance of maintaining numerical accuracy. He is also associated with the University of Oxford, where he has been involved in teaching and research.
Olof B. Widlund is a notable figure in the field of applied mathematics and computational science, particularly known for his work in numerical analysis and scientific computing. He has made significant contributions to the development of algorithms and methods for solving partial differential equations, especially in the context of finite element methods and domain decomposition techniques. Widlund has been involved in various academic and research institutions, where he has contributed to both teaching and mentoring in mathematics and computational methods.
Pablo Parrilo is a notable figure in the field of applied mathematics, particularly known for his work in optimization and control theory. He has made significant contributions to the study of convex optimization, linear programming, and related areas. As of my last knowledge update in October 2021, he is a professor at the Massachusetts Institute of Technology (MIT) and has authored numerous research papers and publications in his domain.
Panayotis G. Kevrekidis is a prominent figure in applied mathematics and theoretical physics, known for his work in the fields of nonlinear dynamics, mathematical modeling, and complex systems. He has contributed extensively to the study of solitons, nonlinear waves, and many-body systems, often using techniques from applied mathematics to address problems in physics and engineering. His research often involves the application of mathematical methods to understand and predict the behavior of various physical phenomena.
Peter Lax is a prominent mathematician known for his contributions to the fields of applied mathematics, partial differential equations, and mathematical physics. Born on May 1, 1926, in Budapest, Hungary, Lax emigrated to the United States after World War II and has had a distinguished academic career, including serving as a professor at New York University.
Pinned article: Introduction to the OurBigBook Project
Welcome to the OurBigBook Project! Our goal is to create the perfect publishing platform for STEM subjects, and get university-level students to write the best free STEM tutorials ever.
Everyone is welcome to create an account and play with the site: ourbigbook.com/go/register. We belive that students themselves can write amazing tutorials, but teachers are welcome too. You can write about anything you want, it doesn't have to be STEM or even educational. Silly test content is very welcome and you won't be penalized in any way. Just keep it legal!
Intro to OurBigBook
. Source. We have two killer features:
- topics: topics group articles by different users with the same title, e.g. here is the topic for the "Fundamental Theorem of Calculus" ourbigbook.com/go/topic/fundamental-theorem-of-calculusArticles of different users are sorted by upvote within each article page. This feature is a bit like:
- a Wikipedia where each user can have their own version of each article
- a Q&A website like Stack Overflow, where multiple people can give their views on a given topic, and the best ones are sorted by upvote. Except you don't need to wait for someone to ask first, and any topic goes, no matter how narrow or broad
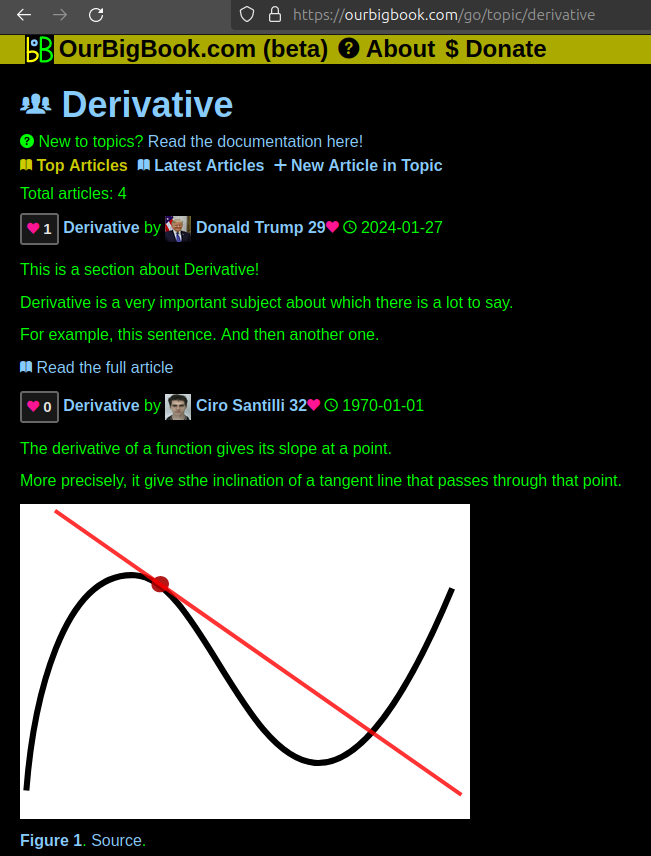
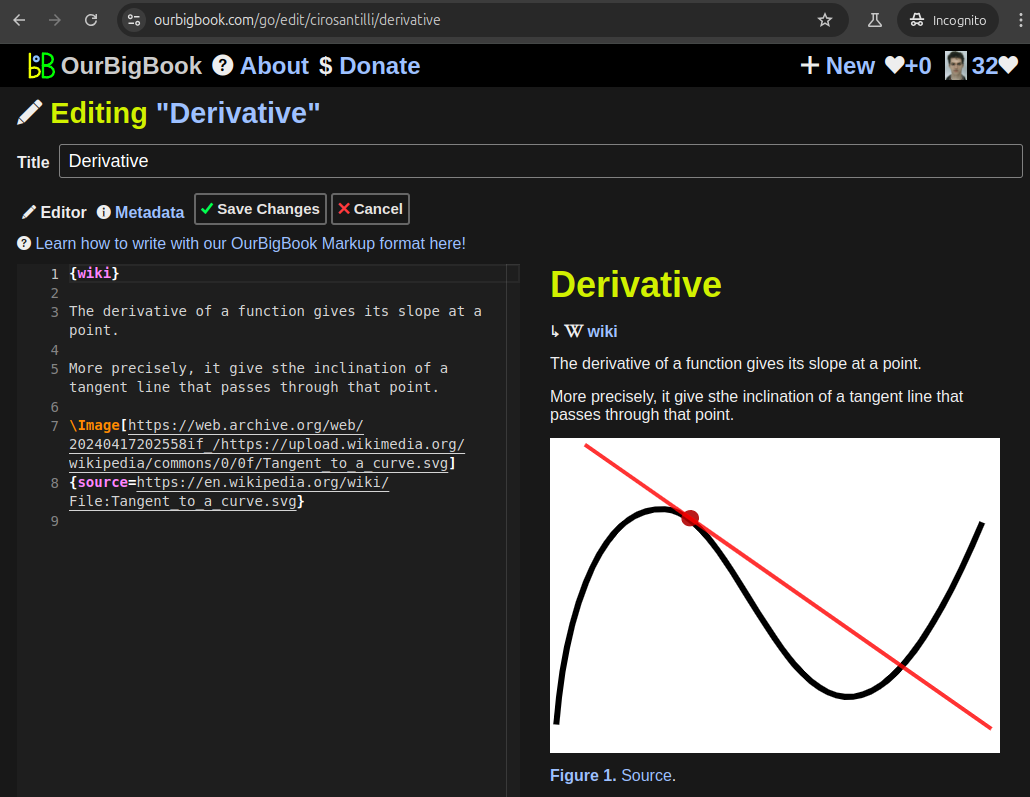
This feature makes it possible for readers to find better explanations of any topic created by other writers. And it allows writers to create an explanation in a place that readers might actually find it.Figure 1. Screenshot of the "Derivative" topic page. View it live at: ourbigbook.com/go/topic/derivativeVideo 2. OurBigBook Web topics demo. Source. - local editing: you can store all your personal knowledge base content locally in a plaintext markup format that can be edited locally and published either:This way you can be sure that even if OurBigBook.com were to go down one day (which we have no plans to do as it is quite cheap to host!), your content will still be perfectly readable as a static site.
- to OurBigBook.com to get awesome multi-user features like topics and likes
- as HTML files to a static website, which you can host yourself for free on many external providers like GitHub Pages, and remain in full control
Figure 2. You can publish local OurBigBook lightweight markup files to either OurBigBook.com or as a static website.Figure 3. Visual Studio Code extension installation.Figure 5. . You can also edit articles on the Web editor without installing anything locally. Video 3. Edit locally and publish demo. Source. This shows editing OurBigBook Markup and publishing it using the Visual Studio Code extension. - Infinitely deep tables of contents:
All our software is open source and hosted at: github.com/ourbigbook/ourbigbook
Further documentation can be found at: docs.ourbigbook.com
Feel free to reach our to us for any help or suggestions: docs.ourbigbook.com/#contact


