A semi-log plot is a type of graph used to visualize data that spans several orders of magnitude. In a semi-logarithmic plot, one axis (usually the y-axis) is scaled logarithmically, while the other axis (usually the x-axis) is scaled linearly. This method of plotting is particularly useful for displaying data that follows exponential growth or decay patterns, as it can make trends easier to identify and interpret.
Articles by others on the same topic

A semi-log plot uses a logarithmic scale on one axis and a linear scale on the other. Which axis is logarithmic matters. Plotting against makes positive exponential functions appear as straight lines; plotting against instead makes an affine function of a logarithm appear straight. The plotting operations change positions while retaining the original tick values.[ref]
Log scale. Matplotlib 3.10.7 documentation; Matplotlib 3.10.7, Log scale: Convenience functions semilogx, semilogy, and loglog; distinction between horizontal and vertical logarithmic axes
Take the original dimensionless mathematical model for . It has exponential growth, with , , and . Taking a base-ten logarithm givesThe slope in these transformed positions is , although the original relative growth rate is . Equal steps of two in multiply by . The corresponding ordinary gains increase, so the left plot bends while the right plot is straight.
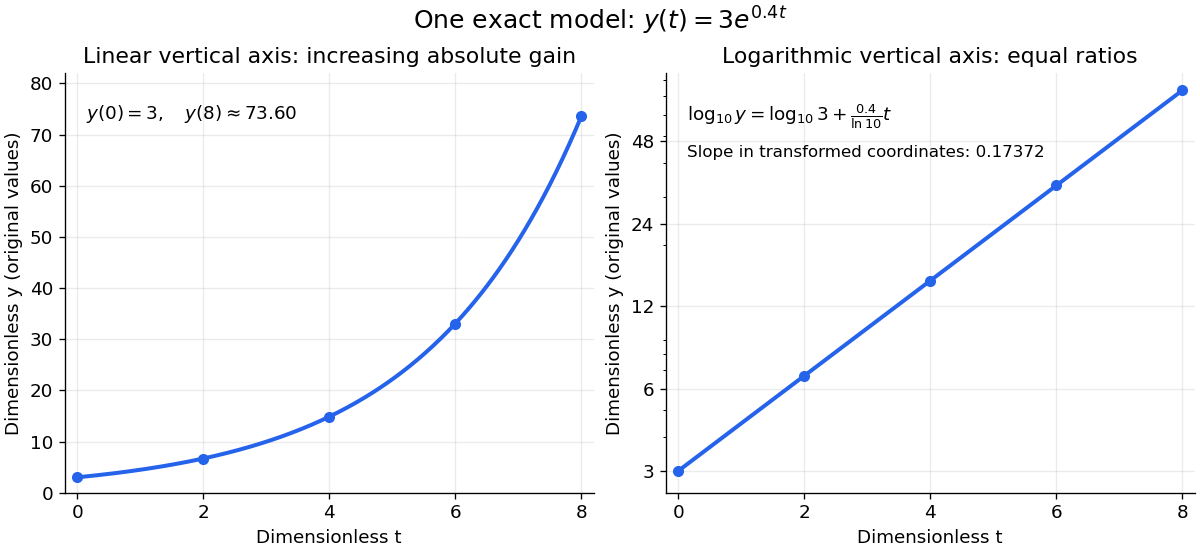
The same exponential growth model bends on a linear scale and is straight on a semi-log plot with a logarithmic vertical axis
. Original exact mathematical model , not measurements. Both panels show identical values at the same . Right-hand tick labels retain the original values, with equal gaps for each doubling. The stated slope is for , not the original derivative . Details.
One practical use is checking a proposed exponential distribution for failure times. For rate and , its cumulative distribution function is , so the reciprocal survival function satisfies . Estimated probabilities can therefore be placed on a logarithmic vertical axis and compared with a straight line. Agreement supports compatibility with the chosen statistical model; a roughly straight finite sample does not establish a unique physical mechanism.[ref]
8.2.2.1. Probability plotting. NIST and SEMATECH e-Handbook of Statistical Methods, §8.2.2.1 Probability plotting: Exponential Model, logarithmic vertical-axis transformation and interpretation of approximate straightness