A logarithmic scale places a positive quantity according to a logarithm, so equal ratios occupy equal distances. For example, are equally spaced under the natural logarithm because every successive difference is . An ordinary linear scale instead gives equal distances to equal differences: .
For a base and a positive reference , define the axis positionThe reference has the same units as , making a dimensionless quantity. The distance between two positions isMultiplying both values by the same positive factor preserves that distance. Replacing by translates every position by ; changing the base rescales positions through . Neither change alters which ratios receive equal gaps.
In base ten, the values occupy positions when . The differences between neighboring values grow from nine to ninety to nine hundred, but every step spans one order of magnitude. The values occupy positions : the same spacing shifted by . This lets one plot small and large positive quantities together while keeping equal proportional changes equally visible.
A logarithmic scale is a rule for position, not an instruction to relabel the tick marks with their logarithms. A mark labelled still means the original value one hundred. Ordinary real logarithms exclude zero and negative inputs. Omitting such values or clipping them to a plotting boundary does not give them genuine logarithmic positions; the plotting choice needs to be clear.[ref]
Log scale. Matplotlib 3.10.7 documentation; Matplotlib 3.10.7, Log scale: Logarithms with other bases and Dealing with negative values
For positive quantities, a difference of one order of magnitude means a factor of ten; a difference of orders of magnitude means a factor of . The logarithmic difference records this comparison, without subtracting the quantities themselves. For example, is three orders of magnitude above one, regardless of a common change of units. Roughly assigning a single value to an order of magnitude also requires a rounding convention; powers of ten are the reference levels.
For positive endpoints , halfway along a logarithmic scale meansHere is the base. Equivalently, using the natural logarithm, . The product of numbers identity for logarithms gives , so the midpoint is the geometric mean . The two endpoints lie at equal multiplicative distances because .
For and , this midpoint is , giving a factor of on each side. The arithmetic mean is halfway on a linear scale, but its two ratios are and . Thus reading halfway between the marks and as on a logarithmic scale gives the wrong value.
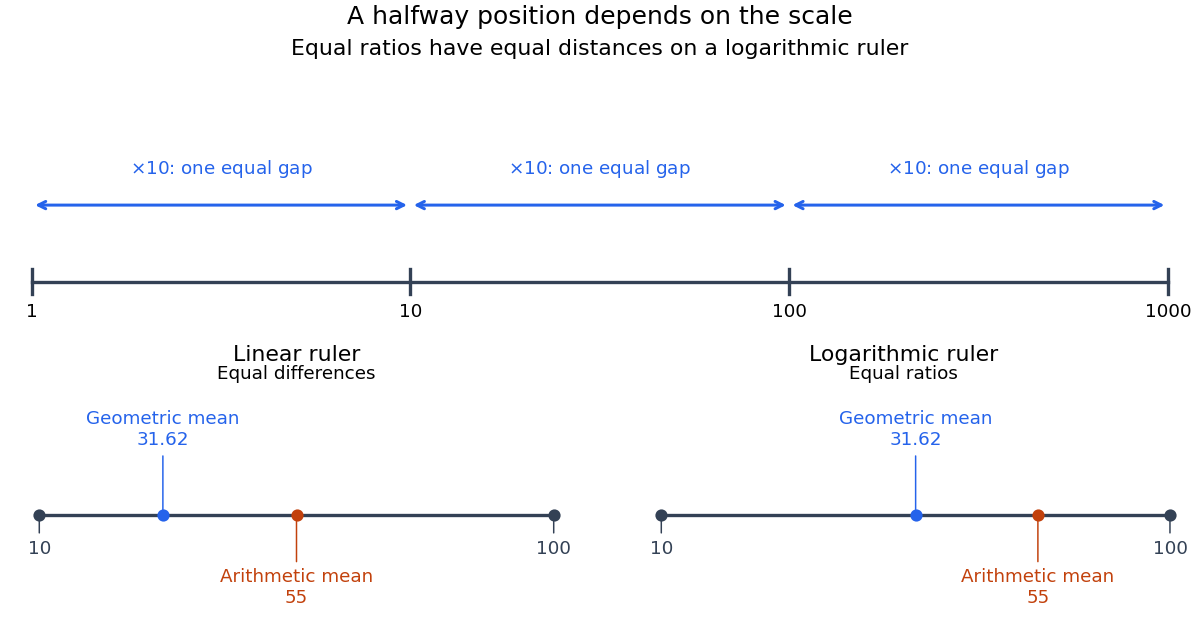
Equal ratios give equal logarithmic gaps, and the geometric mean is halfway between two positive values
. Original rulers calculated from logarithms. The lower rulers cover the same endpoints and : the blue geometric mean is centered on the logarithmic scale, while the orange arithmetic mean is centered on the linear scale. Tick labels show original values. Details.A semi-log plot uses a logarithmic scale on one axis and a linear scale on the other. Which axis is logarithmic matters. Plotting against makes positive exponential functions appear as straight lines; plotting against instead makes an affine function of a logarithm appear straight. The plotting operations change positions while retaining the original tick values.[ref]
Log scale. Matplotlib 3.10.7 documentation; Matplotlib 3.10.7, Log scale: Convenience functions semilogx, semilogy, and loglog; distinction between horizontal and vertical logarithmic axes
Take the original dimensionless mathematical model for . It has exponential growth, with , , and . Taking a base-ten logarithm givesThe slope in these transformed positions is , although the original relative growth rate is . Equal steps of two in multiply by . The corresponding ordinary gains increase, so the left plot bends while the right plot is straight.
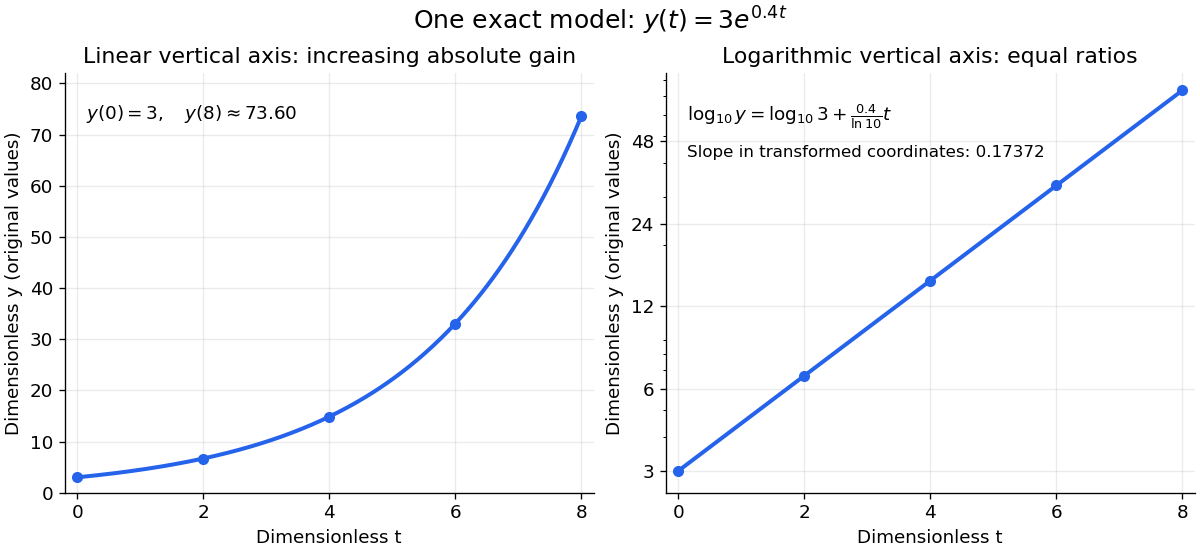
The same exponential growth model bends on a linear scale and is straight on a semi-log plot with a logarithmic vertical axis
. Original exact mathematical model , not measurements. Both panels show identical values at the same . Right-hand tick labels retain the original values, with equal gaps for each doubling. The stated slope is for , not the original derivative . Details.One practical use is checking a proposed exponential distribution for failure times. For rate and , its cumulative distribution function is , so the reciprocal survival function satisfies . Estimated probabilities can therefore be placed on a logarithmic vertical axis and compared with a straight line. Agreement supports compatibility with the chosen statistical model; a roughly straight finite sample does not establish a unique physical mechanism.[ref]
8.2.2.1. Probability plotting. NIST and SEMATECH e-Handbook of Statistical Methods, §8.2.2.1 Probability plotting: Exponential Model, logarithmic vertical-axis transformation and interpretation of approximate straightness
A log-log plot uses logarithmic scales on both axes. For a positive power law with , positive references giveIts transformed slope is the exponent when both axes use the same logarithm base and the slope is measured in logarithmic coordinate units. For example, takes the values at . Every doubling of quadruples , giving slope two on a log-log plot.
This differs from a semi-log plot: a power law has constant proportional response to a proportional change of input, whereas exponential growth has constant proportional response to an additive change of input. Both can appear straight with appropriate axes, so one must read the scale labels before interpreting a slope.
Articles by others on the same topic



A logarithmic scale is a way of displaying numerical data over a wide range of values in a way that can make it easier to visualize and interpret. Instead of each unit being the same size as on a linear scale, where equal intervals on the axis represent equal differences in value, a logarithmic scale represents equal intervals as equal ratios. In a logarithmic scale, each tick mark on the axis represents a power of a base number, commonly 10.