Maximum-likelihood estimator
ID: maximum-likelihood-estimator

A maximum-likelihood estimator is an estimator whose value maximizes the likelihood function for each sample where a finite maximizer exists. Before observation, is a random variable (the choice of maximizer must be a measurable function); after observation, is the numerical maximum-likelihood estimate. A formula must specify the allowed parameter set, including whether its endpoints belong to it.
For ten independent Bernoulli trials, write . On the closed parameter interval , the binomial proportion maximum-likelihood estimator is . Eight successes give the estimate . If , the likelihood is and has its unique maximum at ; if , it is and has its unique maximum at . On the open interval these two samples have no maximum-likelihood estimate: the supremum is one, but it is not attained. This is the same issue as likelihood supremum at an excluded boundary.
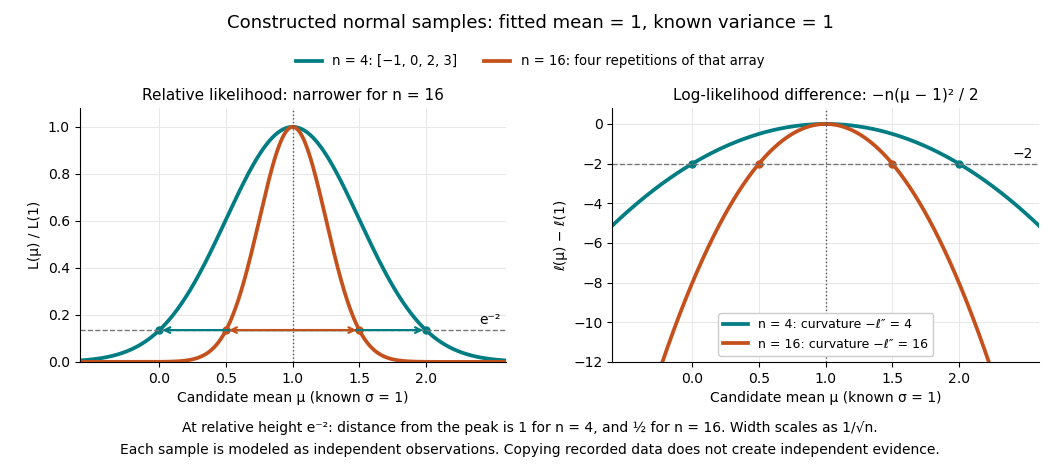
A complete continuous example uses independent and identically distributed random variables with unknown mean and known standard deviation one. Their likelihood function and log-likelihood areThe sum of squared deviations separates asbecause . The first term is fixed in , so the unique maximum-likelihood estimator is the sample mean . This also proves the equivalence with ordinary least squares for this model. With the constructed observations , the sample mean is one and the residual sum of squares is ten; henceAt or , the log-likelihood is two below its peak, so the likelihood ratio to the fitted value is . The absolute likelihood at the peak is , a joint density value, not the probability of observing exactly those four real numbers.
The following figure compares that sample with a constructed sixteen-observation sample consisting of four repetitions of the displayed four values, modeled as sixteen independent draws. Both fits have sample mean one, butThus the observed information is four times as large for as for . The distance from the peak at relative height decreases from one to : the width scales as . This is a comparison of two stipulated samples; merely copying recorded observations would not create new independent evidence.

Even uniqueness needs checking. If the Bernoulli distribution success parameter is written with , eight successes give two maximum-likelihood estimates, , because both give the same probability distribution. The problem is a failure of identifiability. The special cases below show other ways an MLE can have bias or fail the usual asymptotic normality.
New to topics? Read the docs here!