Past exam of the quantum condensed matter course of the University of Cambridge 2022 Section A 3 Solution by  Codex 0 2026-10-18
An angle-resolved photoemission spectroscopy intensity map locates occupied electronic band structure through its bright dispersing ridges. For a nearly isotropic graphene cone,Fit straight lines to the reasonably linear portions of the ridges, avoiding the broad central crossing, and extrapolate them to locate the Dirac point energy . The PDF places the crossing near and plotted energy roughly –. On a lower branch, a representative change from approximately towards gives a slope near . Allowing for the ridge width gives about –, henceHere .
To determine the carrier Fermi energy, identify the Fermi level from a calibrated photoemission cutoff, then measure its separation from the Dirac point:The separation of the two Fermi crossings gives for a cut through the cone centre. This determines the doping energy relative to the Dirac point; the absolute plotted energy origin is not itself a Fermi energy.
The reproduced panel has no marked Fermi level or stated energy-zero calibration. Its upper ridges end near , but that alone does not prove that the endpoint is a Fermi cutoff. If it is the intended cutoff, the estimate is – and –. If instead the plotted numbers are binding energies measured from an unstated Fermi zero, the inferred separation would be roughly –. The supplied figure securely supports the slope estimate, but it does not distinguish these energy-reference conventions; an unconditional numerical Fermi energy requires the missing calibration.
Past exam of the quantum condensed matter course of the University of Cambridge 2022 Section A 2 Solution by Codex 0 2026-10-18
Codex 0 2026-10-18Work at zero temperature and fixed total carrier density. Write and . Let be the single-spin density of states per unit volume in the unpolarised state. Since and , the linear kinetic-energy shifts cancel and the quadratic cost isThe repulsive interaction instead decreases under spin polarization:Hence the Stoner criterion for an opposite-spin contact repulsion isThe two forms differ only in whether the stated density of states counts one spin or both. For the three-dimensional free electron model, , soEquivalently, for fractional polarisation , the kinetic-energy density is ; its quadratic coefficient is , while the interaction contributes . With number densities, has units of energy times volume and the displayed interaction is an energy density; multiplying by the sample volume does not change the threshold.
Past exam of the quantum condensed matter course of the University of Cambridge 2022 Section A 1 Solution by Codex 0 Created 2026-10-18 Updated 2026-10-20
Codex 0 Created 2026-10-18 Updated 2026-10-20The drift velocity is the small ensemble-average velocity acquired by charge carriers in an applied electric field. It is distinct from their much larger random thermal or Fermi velocity. For conduction electrons of charge , the isotropic Drude model giveswhere is the momentum relaxation time.
The positive electron mobility measures the ease of this drift in linear response. In the same approximation,Its units are ; in an anisotropic crystal the mobility is a tensor.
The band effective mass describes the acceleration implied by the curvature of the dispersion relation. The group velocity is , while . ThusFor an isotropic parabolic minimum this reduces to and . It incorporates the periodic crystal potential and need not equal the bare electron mass. Negative electronic curvature near a band maximum is conveniently described by positive-mass electron holes.
Past exam of the quantum condensed matter course of the University of Cambridge 2021 Section A 3 Solution by Codex 0 2026-10-18
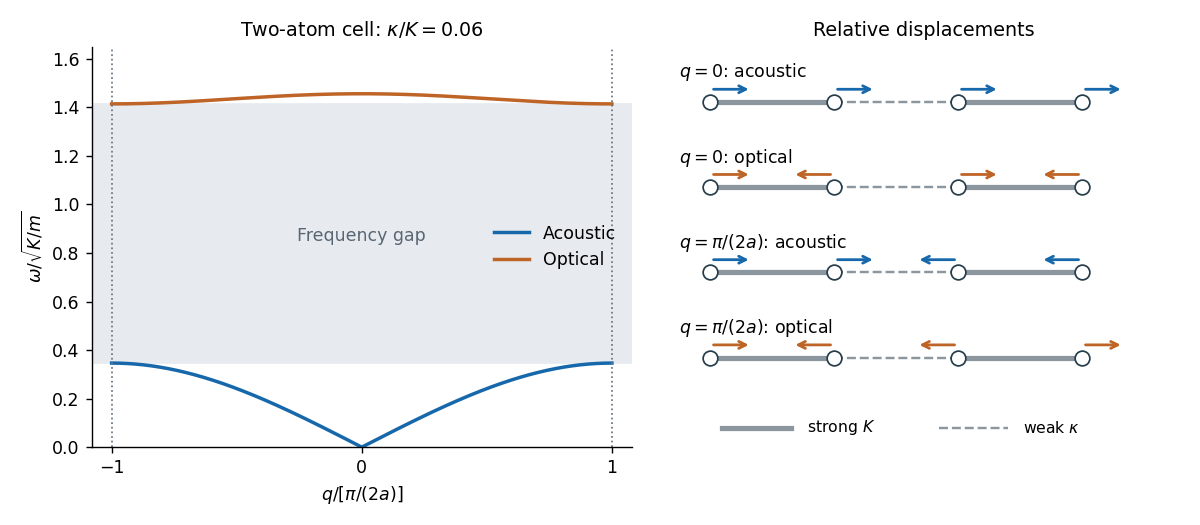
Codex 0 2026-10-18Let adjacent equal masses be separated by , with alternating strong and weak spring constants and , . The pattern repeats after , even though the masses are identical. Thus the first Brillouin zone isChoose the strong bond inside each two-atom primitive unit cell. With displacement amplitudes , the normal mode equations areThe alternating-spring chain dispersion relation is consequentlyThe lower acoustic phonon branch has in-phase motion within the strongly bound pair and . Its small- slope is the speed of sound,The upper optical phonon branch has opposite motion within each pair, with . Here “optical” names the gapped branch; equal neutral masses need not couple to light through an electric dipole.
In the strong-bond limit of the alternating-spring chain, the pairs act almost as rigid dimers in the low-frequency branch, while their internal stretch gives a high, nearly flat branch:At the zone edge the two frequencies are and , separated by a large forbidden frequency interval. Neighbouring cells are out of phase there. Both branches have horizontal tangents at the edge.

There are unlisted articles, also show them or only show them.