The continuous-time frequency response is the frequency response of a continuous-time linear time-invariant system. From zero initial state, a BIBO stable system driven by a sustained sinusoid approaches the steady responseAny decaying initial or switching transient is separate. The modulus is the amplitude gain; the complex argument is the shift in oscillation phase. Thus evaluating a transfer function at measures both how much of an oscillation passes through and how far it lags.
For the first-order low-pass filter, with , direct complex number arithmetic givesThe phase uses the inverse tangent branch between and . Low angular frequencies have gain close to and little lag. High angular frequencies have gain approximately and lag approaching . This is why the model is a first-order low-pass filter: it suppresses fast variation compared with slow variation. Rowell relates frequency response gain and phase to poles and then introduces Bode plots in MIT 2.004, lecture 32, sections 1 and 2.
At the corner angular frequency,For and , , the gain is , and the lag is degrees. The angular frequency is measured in radians per second; ordinary frequency is measured in hertz (cycles per second), with . Consequently the same corner is , not .
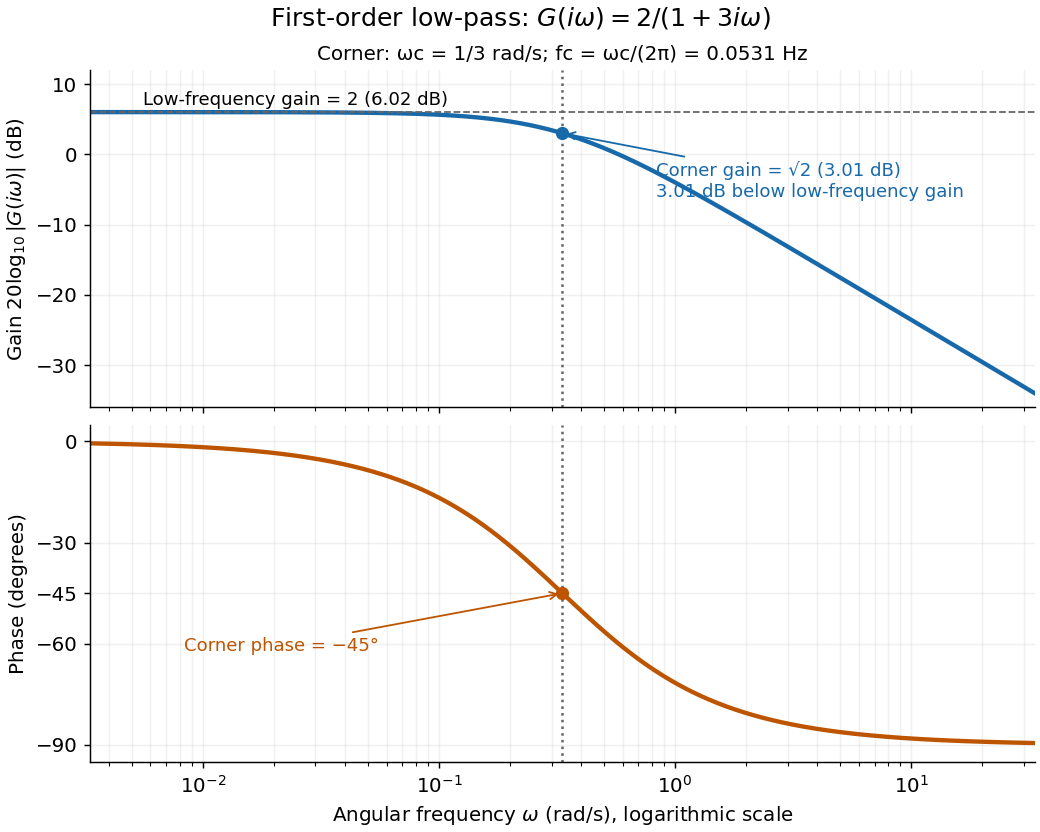

A Bode plot displays the gain and oscillation phase of a frequency response against a logarithmic frequency axis. Gain is often shown as in decibels; phase can use degrees or radians. The first-order low-pass filter loses approximately decibels per factor of ten in angular frequency well above its corner. [ref]
https://www.ocw.mit.edu/courses/2-004-dynamics-and-control-ii-spring-2008/2a0a97261561177bf1a91b07202bb09a_lecture_32.pdf. Rowell, lecture 32, section 2: logarithmic plots
Articles by others on the same topic
There are currently no matching articles.