The frequency response gives the change in complex amplitude of a sustained oscillation under a linear time-invariant system. If the impulse response is finite or has absolute summability, substituting into its discrete convolution yieldsThus is the amplitude gain and its complex argument is the phase change. Real sinusoids follow by taking real or imaginary parts. Here is radians per sample; for cycles per sample. A physical sampling rate converts that normalized frequency into cycles per second.
For a trailing moving average,with removable singularities evaluated from the finite sum. In particular . For and , the five roots of unity sum to zero, so the oscillation is canceled. At small positive frequencies in the first pass region, the real sine ratio is positive and the phase factor gives a delay of samples.
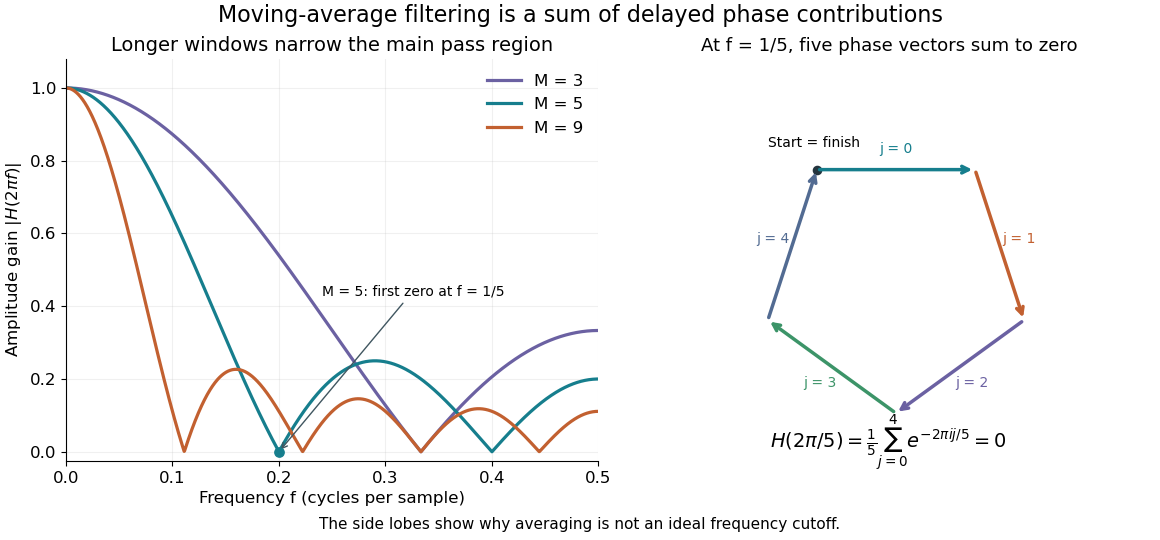
Increasing moves the first zero to , narrowing the main region of large gain. It does not create an ideal low-frequency cutoff: later side lobes transmit some higher-frequency components, and suppressing a component is only helpful when that component is unwanted. The frequency plot is the same operation as the delayed-sample average; the five-vector diagram explains one exact zero geometrically.
Articles by others on the same topic


Frequency response refers to the output of a system or device (such as an electrical circuit, speaker, or filter) as a function of frequency, quantifying how that system responds to different frequencies of an input signal. It is typically represented as a graph showing the amplitude (gain or loss) and phase shift of the output signal relative to the input signal across a range of frequencies.