Take the original observations , with sample mean . All ordered bootstrap samples have probability . The bootstrap sample has sample mean ; has sample mean ; has sample mean . These are illustrative possibilities, not three simulated measurements used to estimate the distribution.
For bootstrap count vectors , records the number of copies of observed slot . Their multinomial distribution isand . Thus the unordered counts have probability , whereas have probability . Stars and bars gives ten count vectors, but assigning each probability would be wrong. Two different count vectors, and , both give sample mean ; combining their probabilities gives .
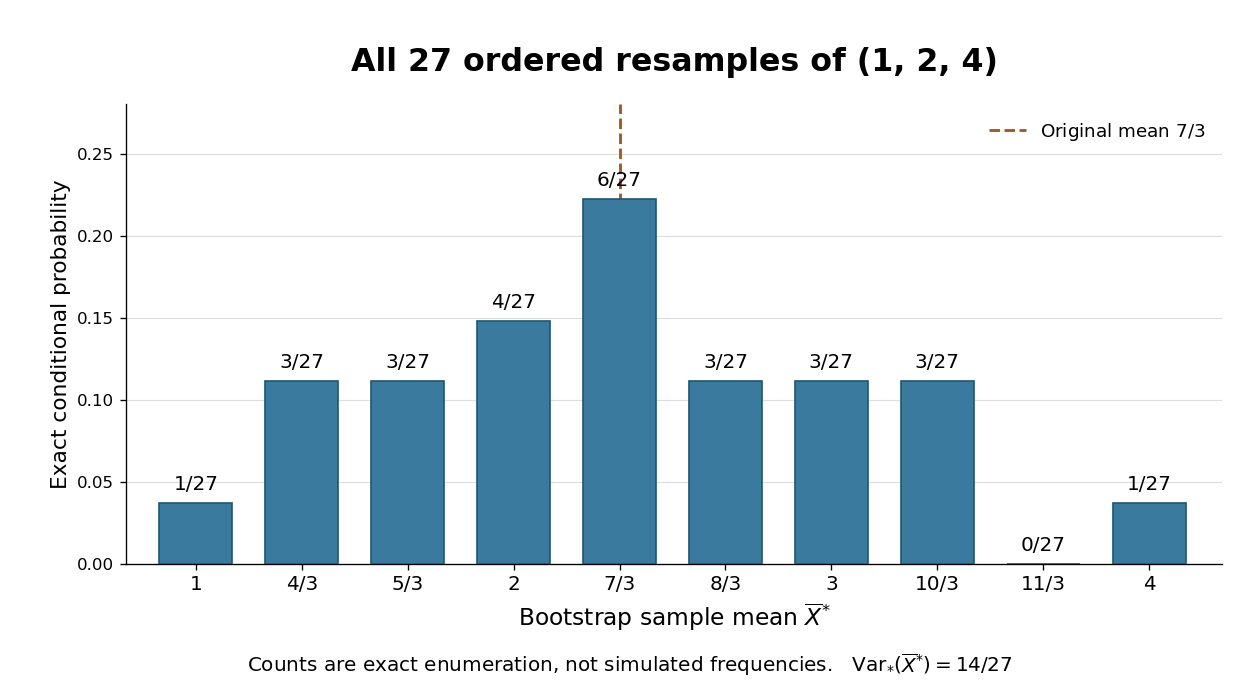

The conditional bootstrap variance of a sample mean gives a compact check on the enumeration. Each resampled draw has expected value and varianceAveraging three independent draws divides that variance by three:The exact conditional bootstrap standard error is . The original sample variance with denominator is , so its usual estimated standard error for the sample mean is . Their squared ratio is here; the difference follows from the empirical measure's denominator , not a numerical simulation error. Neither number is the known true sampling standard error of the unknown source probability distribution.
Articles by others on the same topic
There are currently no matching articles.