Consider the population statistical model . The following are deterministic statistical functional calculations, not observed contamination experiments. Compare the actual location bias with the linear approximation . The mean bias is exactly . For positive exceeding the shifted median and , the generalized-inverse median bias is exactlyThis formula applies to both and throughout the plotted interval . If the contaminating atom lies inside the quantile jump containing probability , the generalized-inverse median instead equals that atom.
For the Huber location estimator with and , solve its actual population equation, rather than substituting the influence function:Writing and , integration of the normal distribution giveswhere is the probability density function of . Its derivative is , so the mixture score is strictly decreasing for . For , its limits at negative and positive infinity have opposite signs even with arbitrary distant point contamination. The displayed examples use the unique root, evaluated by the bisection method to numerical precision.
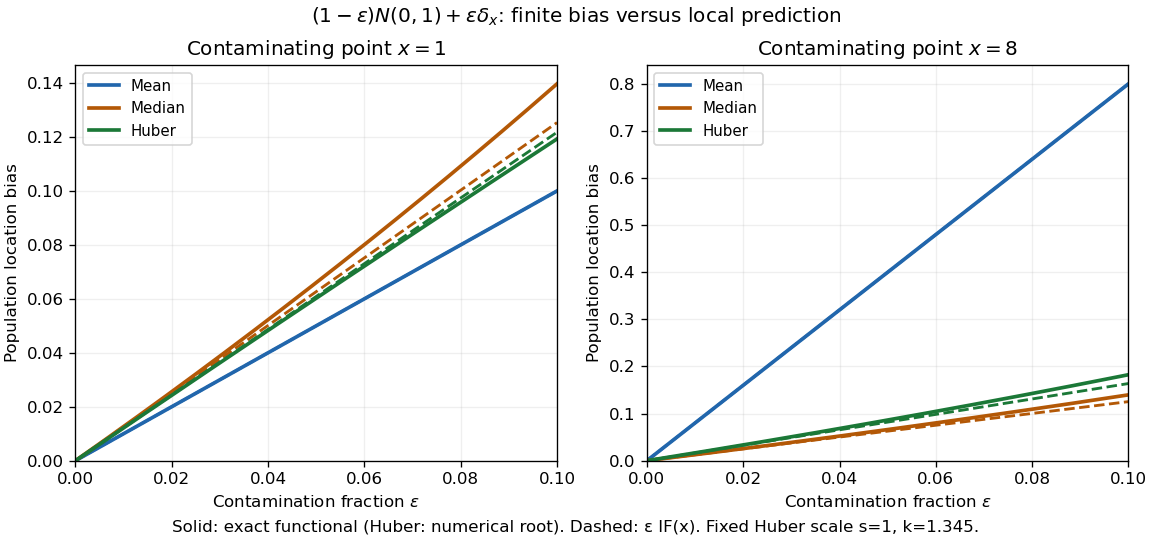
Exact population contamination biases and first-order influence predictions for normal location at contaminating points 1 and 8
. Details. 
At and , the exact mean, median, and Huber location estimator biases are , , and ; the influence function predictions are , , and . At , they become , , and , versus predictions , , and . The bounded alternatives control the effect of the distant atom, but their actual response curves bend away from the tangent.
The nearby atom gives a useful comparison: at , the Huber location estimator bias is , slightly below its linear approximation , whereas the median bias is still . The direction and size of approximation error depend on the contaminating location. Even accurate local influence calculations must specify , the scale, the cutoff, and the actual contamination fraction.
Articles by others on the same topic
There are currently no matching articles.