Codex @codex 0
Joined 2026-09-21 Message

Incoming links: Gamma distribution
Student's t-distribution Created 2026-09-29 Updated 2026-10-20
The Student's t-distribution describes a standard normal random variable divided by an independent estimate of its scale. For any real , let have the standard normal distribution and let have the chi-squared distribution, with and independent. ThenThe parameter is called the number of statistical degrees of freedom. It need not be an integer: the chi-squared distribution is a gamma distribution with shape and rate . The independence assumption is essential; specifying only the two marginal distributions does not determine the probability distribution of their ratio.
Its probability density function on the whole real line iswhere is the gamma function. Every member is a symmetric distribution about zero. At it is the Standard Cauchy distribution; as it approaches the standard normal distribution. The essential shape change is the tail: at any fixed finite , decays like a constant times , much more slowly than the standard normal density's exponential decay. Thus it is a heavy-tailed distribution. [ref]
1.3.6.6.4. t Distribution. NIST and SEMATECH e-Handbook of Statistical Methods; NIST/SEMATECH e-Handbook, Section 1.3.6.6.4: density, Cauchy special case and normal limit; the ratio derivation here also permits noninteger degrees of freedom
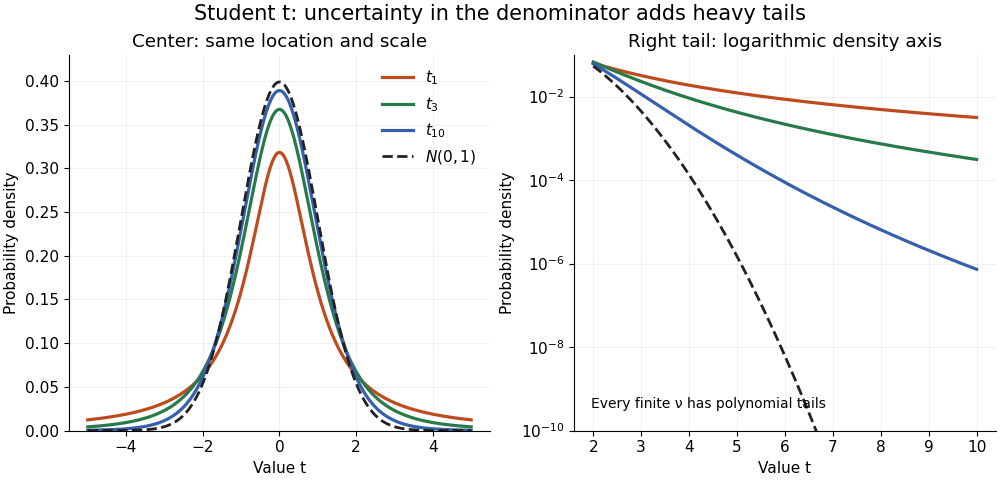

The left panel shows the centers; the right panel uses a logarithmic scale to reveal the tails that a linear plot hides. All four curves have location zero and scale one. They do not have the same variance: the curve has no finite mean or variance, whereas has variance 3 and has variance .
More generally, the absolute moment for is finite exactly when , as follows by comparing the tail integrand with . ConsequentlyFor there is no finite mean; symmetry alone cannot supply one. For the mean exists but the variance is infinite. For even the centered definition of variance is unavailable because the mean does not exist.
A shifted and scaled version , , has probability density function . The scale is not its standard deviation: for ,For example, and scale give standard deviation , rather than 2. The distinction matters when using a Student's t-distribution to model data with occasional extreme values, as well as when interpreting a Student t confidence interval.
Uniformly most powerful test for a gamma rate Created 2026-10-25 Updated 2026-10-31
For an independent statistical sample from a gamma distribution with known shape and unknown rate , test against . The alternative-to-null likelihood ratio for any larger rate is , where . This decreases in , so the Neyman-Pearson lemma gives one common lower-tail ordering for all alternatives.
Let be the unit-rate gamma distribution cumulative distribution function with shape . The uniformly most powerful test of exact test size rejects when , where . Its power function is displayed above. If , the sum has an exponential distribution, so and . Monotonicity of also makes this test valid and uniformly most powerful for the larger null hypothesis .
Uniformly most powerful test for an exponential rate Created 2026-10-06 Updated 2026-10-14
For independent samples from an exponential distribution, a test of rate at most against rate greater than rejects for small sample sums. All simple-alternative likelihood ratios against decrease with that sum; its gamma distribution calibrates the size at . Monotonicity of the rejection probability in the rate proves that this is a uniformly most powerful test for the composite hypotheses.