Molecular diffusion is the component of material transport caused by the random thermal motion of molecules, measured relative to bulk motion of their surroundings. A diffusion coefficient is a property of a particular substance in a particular medium under specified conditions, not a universal speed of spreading. Its dependence on the solute, solvent and temperature is precisely what makes a spreading experiment informative. A random walk idealizes this motion; the Brownian motion description provides a continuous approximation over sufficiently long times. [ref]
https://ocw.mit.edu/courses/1-061-transport-processes-in-the-environment-fall-2008/8260e3e1577cd739ce85143510d9c165_lec_01.pdf. Nepf, MIT: molecular motion and diffusivity
A motivating experiment: watch dye enter a gel. Samprovalaki, Robbins and Fryer studied rhodamine 6G and methylene blue entering agar gel from two side reservoirs. A covered slab, , sat on a controlled thermal stage; the dye was brought to the same temperature. They photographed the gel every ten minutes, averaged image intensity across a strip, and fitted the changing concentration to a diffusion equation model. The cover limited evaporation and stopped dye travelling over the gel surface. Runs at , and were repeated in triplicate. The measured spatial colour change therefore supplied a quantitative transport test, rather than merely showing that dye eventually spreads. Changing lighting also changes image intensity, so the optical response had to be checked. Importantly for interpretation, their constant-diffusion coefficient fit was imperfect and the gel coefficient is an effective transport coefficient, not automatically the value in free water. [ref]
A finite-pulse version to test width growth. The following is a proposed teaching variant, not that paper's apparatus or a report of measurements. Make a long, narrow, transparent gel channel of uniform cross-section. Join a thin dyed gel band between two undyed lengths of the same gel, with good contact and no air gaps; the dye should initially fill the cross-section so the dominant concentration variation is along the channel coordinate . After assembly, keep the covered channel horizontal at uniform temperature, away from vibration. The dye is a finite initial pulse: no reservoir supplies more dye. Choose a dye whose image response can be calibrated and whose interaction with the gel is small enough for an approximately constant diffusion coefficient to be plausible.
Photograph the whole pulse at recorded times with fixed lighting, focus and exposure, including a length scale. Use uniformly dyed standards of the same gel thickness and a blank gel to convert image intensity to concentration ; do not assume raw brightness is proportional to concentration. Average across the channel width and examine several parallel strips to check the one-dimensional approximation. Measure the initial profile instead of treating the band as infinitely thin. For a finite pulse with negligible end effects, define its spatial integral , centre and width byHere is the variance of the normalized profile , and is its standard deviation. If is measured in , then has units ; multiplying by the channel cross-section gives the total amount of substance. For the unbounded one-dimensional diffusion equation with constant , conserved , finite variance and sufficiently decaying tails,Thus plot width squared against time: its slope determines the diffusion coefficient, while its intercept includes the finite starting width. This moment law holds even for a non-Gaussian distribution initially; it follows by applying integration by parts twice to the diffusion equation. [ref]
https://ocw.mit.edu/courses/1-061-transport-processes-in-the-environment-fall-2008/68b0a4a664246168ee639298b39384b1_lec_03.pdf. Nepf, MIT: profile moments and estimating diffusivity from variance growth
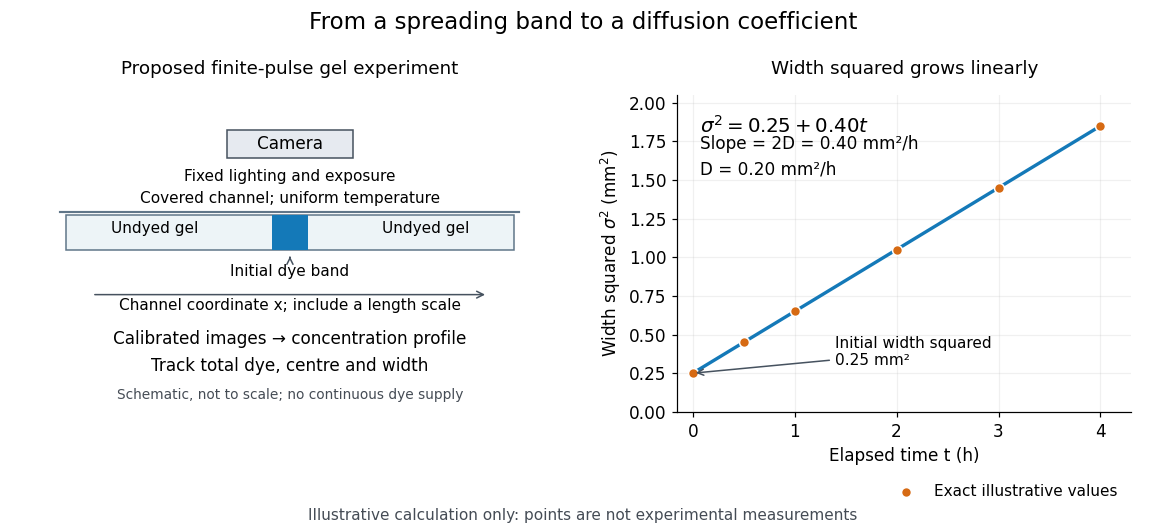
Measuring molecular diffusion from the growth of width squared
. Original schematic of the proposed finite-pulse gel experiment, with an illustrative calculation rather than measured data. A camera records the broadening band. The plotted points are exact samples of with in and in hours; the slope gives the chosen . The schematic is not to scale and is not a reproduction of the published apparatus. Details.For the particularly readable case of an initially Gaussian distribution centred at zero, uniform advection at speed and constant diffusion coefficient give the one-dimensional concentration profileIts centre moves as and its variance grows as . Our illustrative choice and gives widths , and at zero, one and four hours. These are calculated values, not a measured dye coefficient. Once dominates the initial variance, width grows as : four times the elapsed time gives approximately twice the width. A rectangular starting band will not immediately have a Gaussian distribution, although the same width-squared law still applies under the stated assumptions.
Controls and limits of the interpretation. In the proposed experiment, check that stays constant and that the centre remains stationary while the width increases. Include a blank and a uniformly dyed gel photographed over the same period: an apparent signal change there exposes lighting drift, dye fading or evaporation. Repeat with a lower starting dye concentration and a second initial width; agreement of the slopes is a check on constant and on preparation effects. Keep the pulse far from the channel ends and record its faint tails: truncation and background errors can strongly bias a variance. Poor contact, dye binding, chemical reactions or transport in a liquid film can invalidate the simple model. A gel suppresses bulk liquid motion, but its inferred diffusivity need not equal that in the pure solvent. A stationary centre alone does not exclude symmetric flows, and linear width-squared growth alone does not prove a molecular mechanism: turbulence can also produce an effective diffusive description. These are reasons to combine the profile test with the controlled setup.
Articles by others on the same topic


Molecular diffusion is the process by which molecules move from an area of higher concentration to an area of lower concentration due to their random thermal motion. This movement occurs in gases, liquids, and even solids, but it is most commonly observed in gases and liquids. The driving force behind diffusion is the concentration gradient, where molecules naturally spread out in an attempt to reach a state of equilibrium.