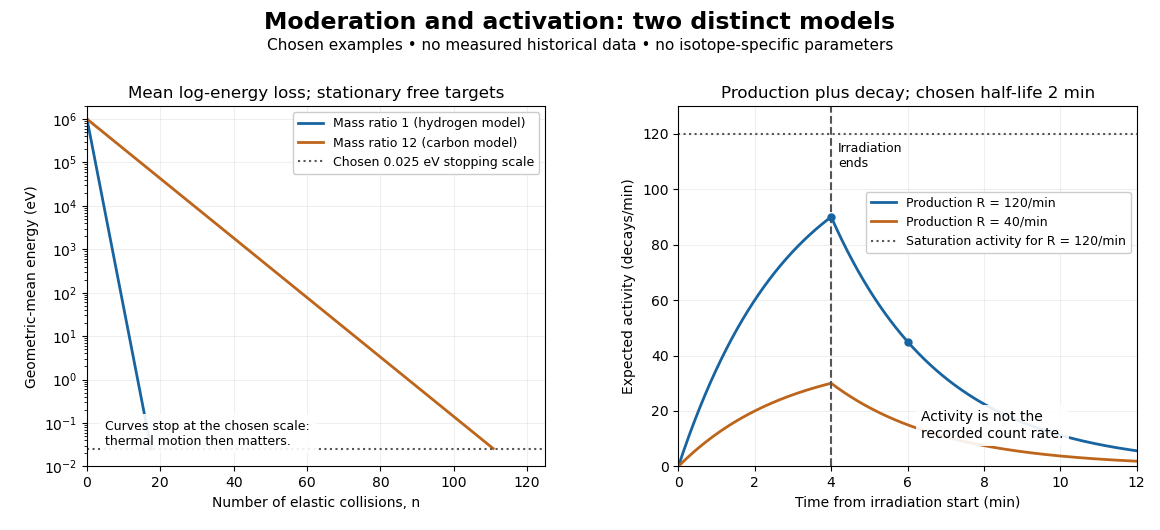
Let be the expected value of the number of radioactive product atomic nuclei, initially zero, produced at constant rate . Let their nuclear decay constant be . Assume one product species, negligible target depletion and negligible capture by the product. During irradiation, production adds while radioactive decay removes in expectation. Multiplying the resulting ordinary differential equation by givesThe expected radioactive activity tends to the production rate . This saturation is a balance of continuing production and radioactive decay, not exhaustion of target atomic nuclei.
If irradiation ends at , let denote elapsed time afterward. Setting the production term to zero givesFor detection efficiency , constant background count rate , delay and counting-window duration , integrating the expected count rate givesThis assumes at most one recorded pulse per product transformation and negligible counter losses. Detector response, branching fractions and background must be calibrated independently. Subtracting an estimated background does not remove its counting uncertainty. Several products give a sum of these terms with distinct nuclear decay constants; a single exponential decay fit can then mislead.
For a wholly stipulated example, choose , half-life and . Then , and . Choose , and . The result isThe background contributes four expected counts. Multiplying the initial net count rate in that window by its duration would give net counts, overestimating the integrated because the product decays appreciably during counting. All these values and the following curves are original examples, not measured historical data or parameters assigned to a particular silver isotope.

Articles by others on the same topic
There are currently no matching articles.