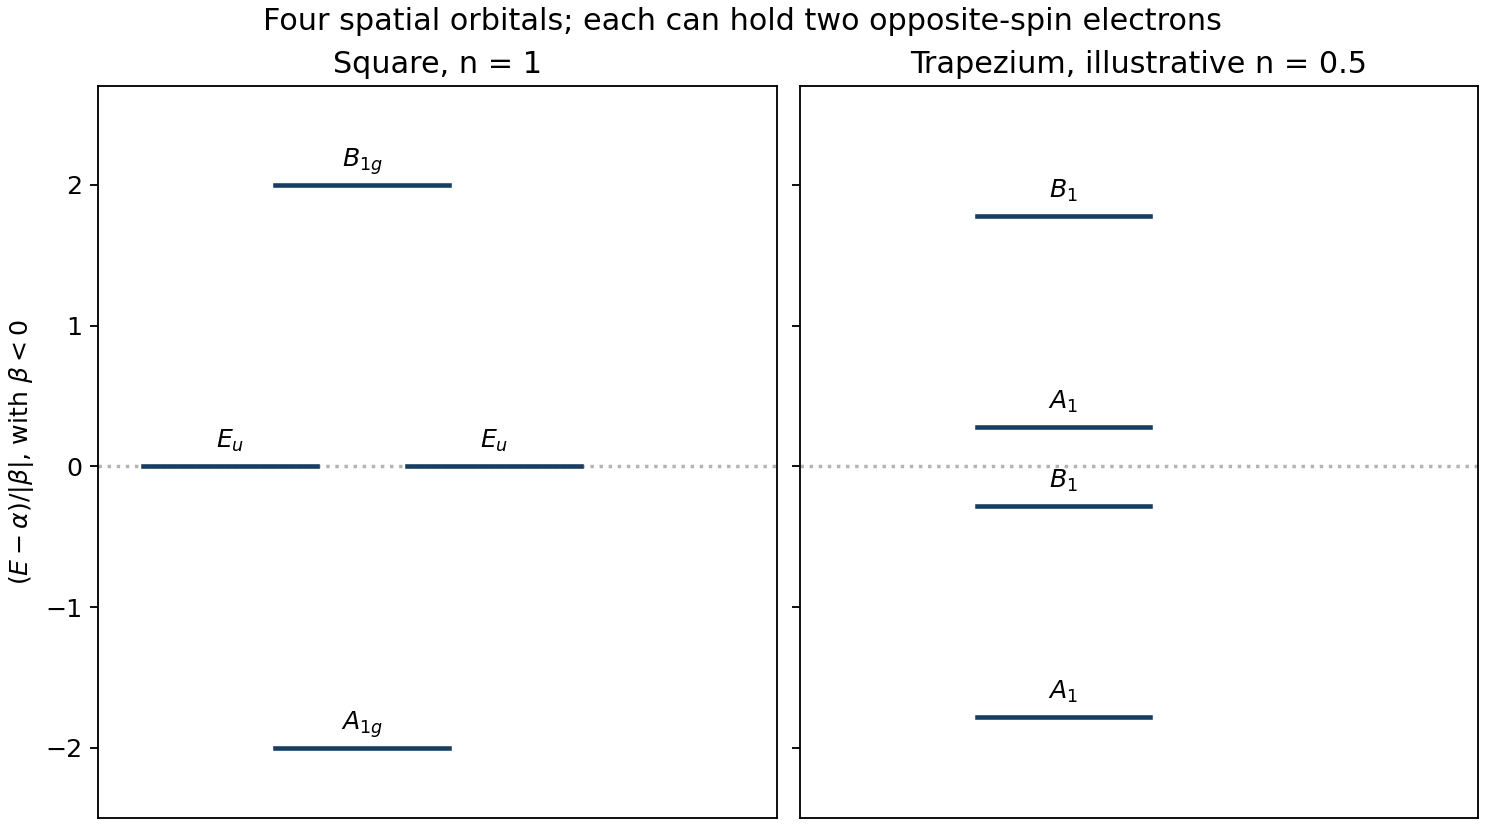
The molecular orbital diagram has one level at labelled , two degenerate levels at labelled , and one level at labelled , in increasing energy for . Each spatial molecular orbital admits two opposite-spin electrons. The diagram below also shows how one representative distortion lifts the middle degeneracy; the distorted scale is illustrative, not a fitted molecular spectrum.

Articles by others on the same topic
There are currently no matching articles.