The drawn axes pass through opposite sites, rather than along the square edges. In the D4h molecular point group class order , an s orbital contributes whenever its centre is fixed and zero otherwise. ThusFor example, a transverse twofold rotation about the printed axis fixes sites 1 and 3, while its diagonal counterpart exchanges all four sites. Reflection in the square plane fixes every site. Taking character inner products, with class sizes , givesThese have dimensions . The label is tied to the printed diagonal-axis convention; rotating the transverse coordinate labels by would interchange and .
Treat the site atomic orbitals as orthonormal, as in the Hückel method. A normalized set of symmetry-adapted linear combinations isThe first combination is unchanged by every operation; the alternating combination has the transformation signs of for the printed axes. The last two transform together like . The squared coefficients sum to one in each case, and their pairwise inner products vanish. Any orthogonal rotation of the two combinations is an equally valid basis for that degenerate subspace.
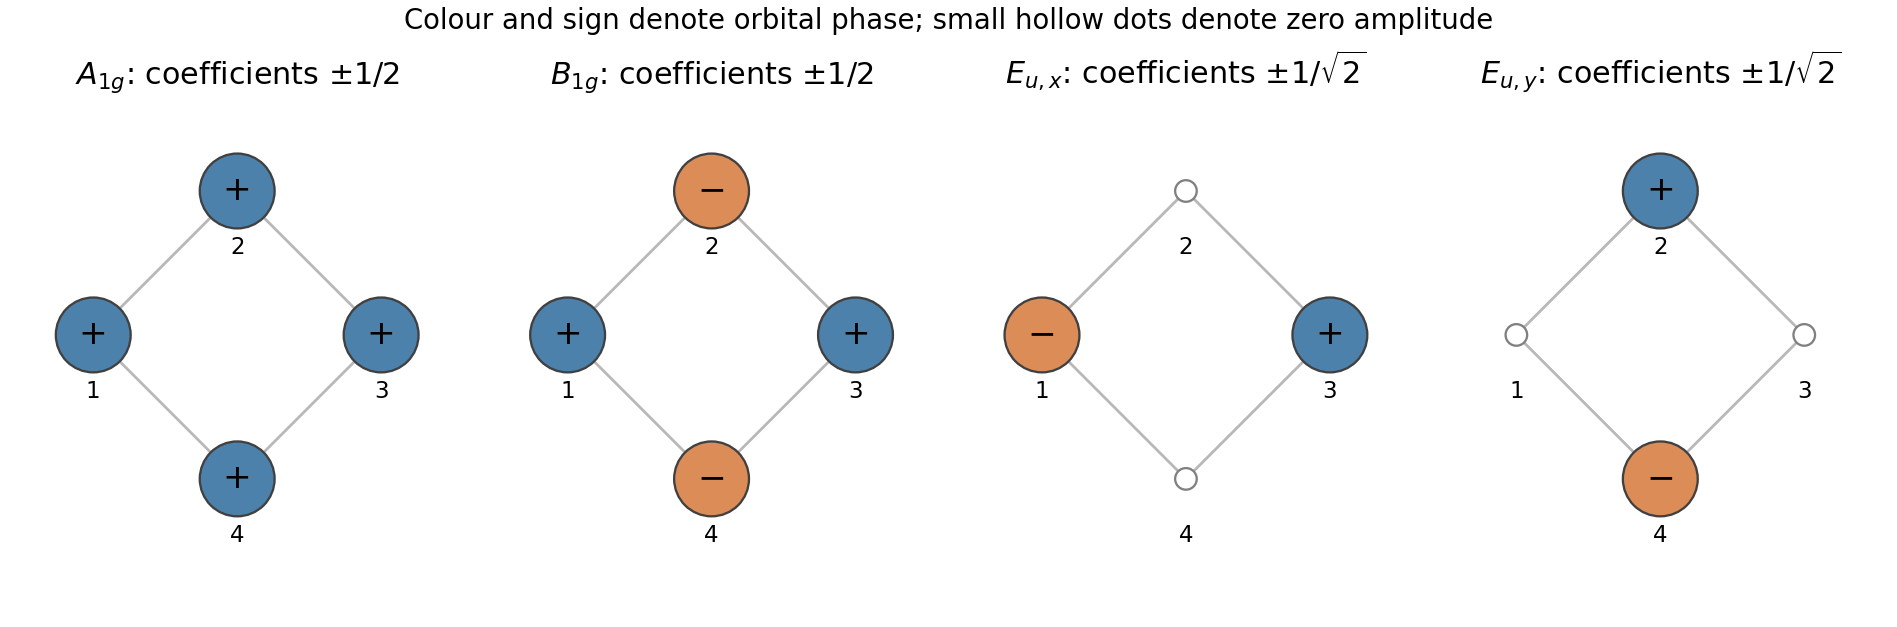
Use a common Coulomb integral on each site, a resonance integral on each adjacent pair, zero interaction across a diagonal, and the identity overlap matrix. In site order the Hückel method givesApplying it to the four symmetry-adapted linear combinations givesFor the conventional bonding sign , the all-in-phase combination is lowest and the alternating combination is highest. The combinations have canceling nearest-neighbour interactions and are nonbonding within this model.
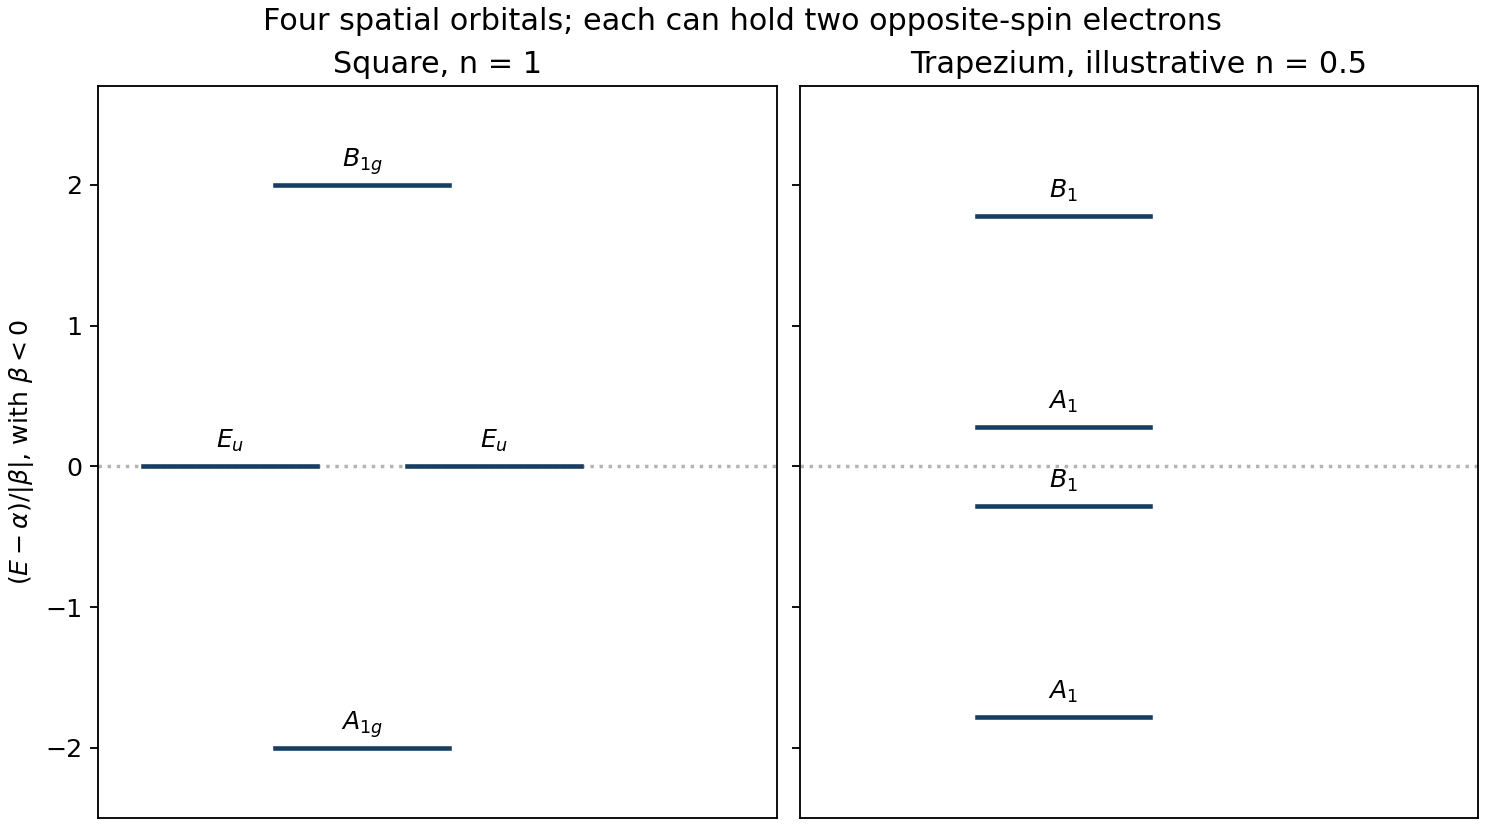
The molecular orbital diagram has one level at labelled , two degenerate levels at labelled , and one level at labelled , in increasing energy for . Each spatial molecular orbital admits two opposite-spin electrons. The diagram below also shows how one representative distortion lifts the middle degeneracy; the distorted scale is illustrative, not a fitted molecular spectrum.


Articles by others on the same topic
There are currently no matching articles.