The permitted transitions form the following diagram. Each arrow is labelled by its fitted transition intensity in units of inverse years; the absence of an arrow is a structural restriction, not an estimated small effect.
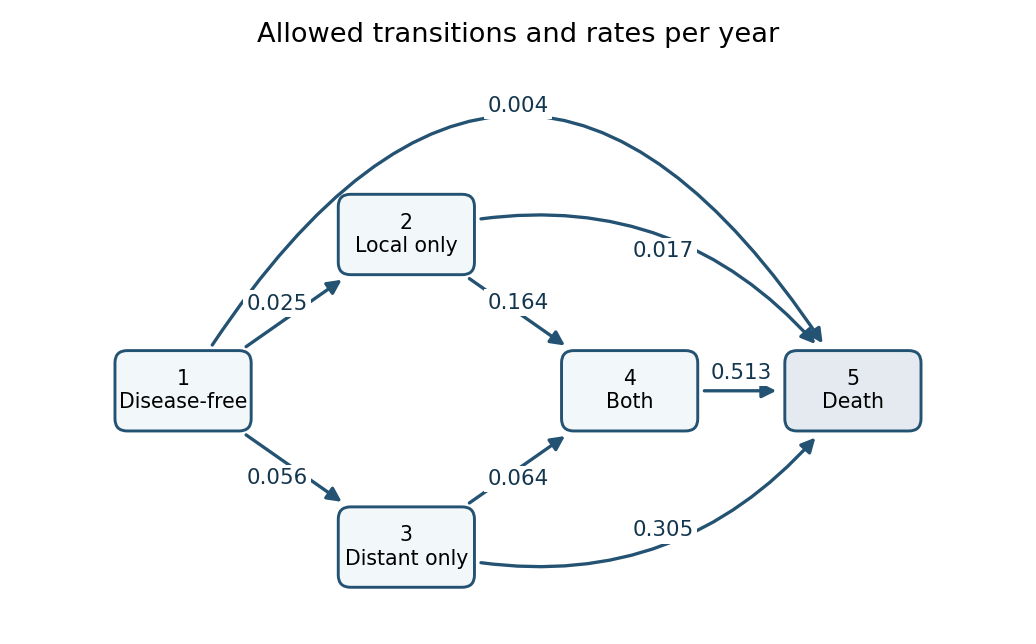

State 1 can move directly to 2, 3 or 5; state 2 can move to 4 or 5; state 3 can move to 4 or 5; and state 4 can move only to 5. There are no recovery transitions, and state 5 is an absorbing state. The rates of leaving the four living states are the sums of their outgoing arrows:The diagonal generator entries are their negatives, so every row of sums to zero. These diagonal entries are not arrows or negative event rates. For example the direct rate is per year, while death after reaching another state can occur at a much larger rate. The printed fit has no covariates on the intensities, so it estimates one pooled rate system and contains no treatment-effect comparison, despite the trial's treatment randomization. The reported describes the fitted likelihood level; by itself it is not a goodness-of-fit test without a reference or competing model.
For a homogeneous continuous-time Markov chain, the holding time in a living state before the next transition has survival probability , where . Indeed, conditional on still occupying that state, the probability of leaving in the next is , so its survival function satisfies and . Integrating gives the mean holding time from a transition intensity matrix:This is the mean time until any allowed exit from that state, not necessarily the patient's remaining lifetime.
For confidence limits, use the supplied standard error of the corresponding diagonal generator estimate. Changing its sign does not change its standard error, so it is also the standard error of . The delta method, with derivative , givesThe resulting approximate 95% Wald confidence intervals areThe diagonal standard errors already incorporate the covariance among outgoing rates. They should not be replaced by the square root of a sum of squared off-diagonal standard errors, which would silently assume those rate estimates independent.
Alternatively construct a positive rate confidence interval and apply the confidence interval for an inverse rate transformation. Here every normal rate interval has a positive lower endpoint, givingThese approximate intervals are, respectively, , , and years. They are asymmetric because inversion is nonlinear; positive log-rate or likelihood-based intervals could also be inverted. The symmetric delta intervals and the inverted-rate intervals are two legitimate first-order approaches and need not have numerically identical endpoints.
The death state has zero exit rate, so its holding time is infinite. There is no finite mean-sojourn estimate or ordinary finite confidence interval for this structurally absorbing state. All intervals above concern the mean parameter, not a prediction interval for one patient's realized holding time.
The transition matrix over five years is . Its first row conditions on starting in state 1. The displayed approximate probabilities mean that, five years later, about 65% remain disease-free, 6% have local recurrence only, 10% have distant metastasis only, 2% have both, and 16% have died. They are probabilities of the states occupied at five years; they are not the probabilities of the next jump destinations or annual transition intensities. In particular the positive probability of state 4 does not require a direct arrow: the paths and contribute to it. The probability of death includes deaths after any allowed sequence of intermediate states.
The printed row sums to rather than one because the entries are approximate; an exact stochastic transition row sums to one. Exponentiating the displayed three-decimal generator gives approximately , illustrating that the edited, low-precision table should not be treated as an exact matrix exponential of its separately rounded rates.
State 5 is an absorbing state, so once entered it can never be left. Its generator row is zero, and the last row of every positive-time transition matrix is thereforeThis explains all four leading zeroes in the printed last row.
Articles by others on the same topic
There are currently no matching articles.