Let be the design matrix with row , let , and write . Independence gives the Poisson regression likelihood functionThe score function and negative Hessian matrix areBecause , the score has mean zero; independence and the Poisson distribution variance give . Thus the observed and expected Fisher information matrices are the same here.
Assume has full column matrix rank . For a nonzero vector , . The concavity of the Poisson regression likelihood therefore makes any finite solution of the unique maximum-likelihood estimator. If the design is rank deficient, parameters differing by a vector in give the same distribution, so only identifiable combinations can be estimated. Full rank alone does not ensure a finite maximizer: for an intercept-only model with all observations zero, approaches its supremum as . More generally, directions that decrease only fitted means attached to zero counts can produce boundary fits. A useful sufficient case for a finite fit is full rank with every count positive: each summand tends to in either tail, and some diverges whenever diverges.
For an interior fit, Newton's method and Fisher scoring give the same update:This is also iteratively reweighted least squares. Define the working response , with , and regress on using weights :A numerical implementation solves these linear equations rather than explicitly forming the inverse, checks convergence of the score and likelihood, and can shorten a step when necessary.
Under the usual fixed-design regularity conditions, with growing information and no single observation dominating it, a score Taylor expansion about the true parameter givesEstimate the covariance matrix by ; its diagonal square roots are the coefficient standard errors. This justifies large-sample Wald confidence intervals and Wald tests for specified coefficients or contrasts. Finite-sample unbiasedness is not being asserted. A likelihood-ratio test compares nested fits through twice their maximized log-likelihood difference. The Poisson deviance against the saturated fit iswith . Residual diagnostics and a check of overdispersion assess whether the assumed Poisson variance is adequate; the variance correction required when it is not is derived in the next part.
The working score function and its derivative areAt an interior working maximizer, . A Taylor expansion at yieldsfor an intermediate value . When the last term is negligible relative to the linear one, this givesThis is the Poisson score linearization under proportional variance. Correct specification of the mean alone implies . The stipulated independence and variance relation giveTaking the mean and variance of the linear approximation therefore provesThese are first-order conclusions, not exact finite-sample identities. The mean and variance assumptions alone do not guarantee that the approximation is accurate: an interior consistent solution, increasing information, control of leverage, and a suitable central limit condition are needed for normal inference.
The quasi-likelihood score for variance is , so its zero is unchanged by the unknown common dispersion parameter. Thus the working Poisson estimating equation remains appropriate for the mean parameter, but its unadjusted Poisson variance estimate is wrong when . A usual Pearson dispersion estimator for this one-parameter model isIn particular overdispersion multiplies coefficient standard errors by approximately , even though it leaves the coefficient estimating equation unchanged.
Treat the counts as independent binomial distributions, , conditional on the known numbers of operations. The null hypothesis is that the probabilities are all equal, with no assumed numerical value. Centre 4 has no operations in this period and hence contributes likelihood one, supplying no information about its mortality probability. The empty groups in a binomial homogeneity test principle leaves 11 contributing centres and 10 test degrees of freedom.
Under the common-probability model the maximum-likelihood estimator isUse the two-column contingency table of deaths and survivors, deleting its all-zero row. The Pearson chi-squared test of homogeneity has statisticUnder the null, the large-sample reference distribution is . The expected counts are adequate for this approximation here, including at the smallest nonempty centre. Calculating givesAn alternative is the likelihood-ratio test against separate centre probabilities, with binomial devianceThe unrestricted probabilities are ; subtracting one fitted common probability leaves the same 10 degrees of freedom. Here and . Thus there is strong evidence against a common mortality probability. This omnibus test does not identify Centre 1 as the sole source of the heterogeneity. If its comparison with the remaining centres is the primary scientific question, specify a separate planned one-versus-rest comparison; inspection of many pairwise comparisons calls for consideration of multiple testing.
Use the logit link and independent counts . This gives a grouped-binomial logistic regression with 24 cells and 13 free coefficients: an intercept, 11 centre contrasts, and one period contrast. Reference treatment coding makes the intercept the log odds for Centre 1 in the earlier of the two included periods. The two factors are assumed to have been coded as specified in the question.
The binomial log-likelihood, apart from known constants, isMaximize by Fisher scoring or iteratively reweighted least squares. Using response proportions with binomial trial weights is equivalent to using the count response ; omitting those weights would give the wrong likelihood and standard errors. The coefficient covariance matrix is approximately the inverse of .
The fitted reference log odds are , and the period change is , givingThese are fitted probabilities under a common period effect, so they need not equal the separate empirical proportions at Centre 1. The estimated period odds ratio isThus the later-period death odds are estimated to be about 35% lower at each centre, with strong evidence of a period effect: the normal Wald statistic is . The displayed “t value” is a coefficient divided by its standard error; with fixed binomial dispersion its usual large-sample calibration is standard normal, not a Student distribution with an estimated Gaussian-error variance. The odds ratio is not a mortality probability ratio.
Each centre coefficient is a log odds ratio relative to Centre 1, adjusted for period. All its point estimates are negative, so all other centres have lower fitted mortality probabilities in either period. For example, Centre 11's odds ratio is , or about times greater odds at Centre 1 than at Centre 11. Individual unadjusted two-sided Wald tests find significant differences at the 5% level for centres 2, 4, 6, 7, 8, 9, 11 and 12; the coefficients for 3, 5 and 10 do not individually reach that threshold. These separate tests are correlated comparisons against a common reference and should not be presented as 11 independent discoveries without considering multiple testing. They adjust only for time period, not for differing patient case mix.
For fit assessment, the residual binomial deviance is on statistical degrees of freedom. Its upper tail is approximately , so there is no appreciable evidence of lack of fit to these binomial cell counts. In particular, comparing with a saturated centre-by-period model gives this same deviance and 11 additional parameters; the data do not strongly require a centre-period interaction. The moderate deviance residuals are consistent with that assessment, although a residual plot by centre and period would be more informative than the five-number summary alone.
The reduction from null to fitted deviance isIt tests the 12 centre-and-period coefficients jointly against an intercept-only model, with reference and . It is not a centre-only test adjusted for period. For that test, fit the period-only model and compare its deviance with the full fit: the pooled binomial probabilities in each period give deviance , soThus centre heterogeneity persists after allowing for period. Dispersion one is the stipulated binomial variance, and the five scoring iterations describe numerical convergence rather than statistical evidence. The fitted associations alone do not establish a causal difference in surgical quality.
The first output uses the equal-variance, pooled Student's t-test, as shown by its seven statistical degrees of freedom. Its exact model assumes two independent samples from normal distributions, with means and a common unknown variance . The hypotheses are against . The sample means are and , and the unbiased within-sample sample variances areThe pooled sample variance and its resulting standard error areHenceTo justify its reference distribution, under the null is standard normal, while is , independently of the two sample means. Dividing the first variable by the square root of the second divided by seven gives the exact pooled two-sample t statistic, with Student t-distribution . Its one-sided p-value is the lower tailThe associated one-sided 95% confidence interval for isThe printed missing lower bound means that this is a one-sided upper confidence limit, not that a finite lower endpoint should be estimated. With such small samples the normality and common-variance assumptions matter; a Welch analysis would use a different variance estimate and generally different degrees of freedom.
The second output is the Wilcoxon rank sum test for two independent continuous samples. Under a common-distribution null hypothesis, labels are exchangeable conditional on the pooled values, so the four ranks assigned to the first sample form a uniformly chosen four-element subset of . The first sample receives ranks , giving raw rank sumEquivalently the Mann–Whitney U test statistic is , the number of cross-sample pairs with an observation larger than a observation. This output reports the raw rank sum, rather than the shifted statistic used by some software.
A first sample tending to be smaller has a small rank sum. Under the null, all rank allocations have equal probability. Only and have rank sum at most 11. By the exact rank-sum tail one above the minimum, the exact lower-tail p-value isNo large-sample normal approximation or continuity correction is involved; the absence of ties makes this simple enumeration valid. For a common-shape location-shift family, the test's alternative is a negative location shift of relative to . Without that model, the null is equality of distributions and the rank comparison is not simply a test of equality of means or medians.
Both tests reject at the 5% level in the direction of smaller observations; only the pooled t-test rejects at 1%. The t-test uses the numerical spacing and targets a mean difference under its normal model. The rank-sum test uses ordering and an exact exchangeability calculation, avoiding the normality and common-normal-variance assumptions. Their different p-values therefore reflect both different statistics and different modelling assumptions, not a numerical contradiction.
The commands read the 52 cell values into a vector and build the matching two-factor layout. In
expand.grid(country, goods) the first factor varies fastest, so the four countries are listed successively within each goods category. This matches row-by-row reading of the displayed table. Converting Goods to a factor is essential: its labels identify 13 categories and are not a quantitative trend. Country supplies the other categorical factor. The summaries suppress coefficient correlations, not coefficient standard errors.The first fit is the additive two-factor normal linear modelThere are free coefficients and residual statistical degrees of freedom. This is two-way analysis of variance without an interaction term. For this complete balanced layout, ordinary least squares givesThese formulas follow from the row- and column-sum normal equations: fitted row and column totals equal their observed totals. The balanced-design coefficient standard errors are for a goods contrast, for a country contrast, and for the reference-cell intercept. These yield the common contrast standard errors and the different intercept standard error in each summary. In particular the intercept is the fitted Software–UK value, not the grand mean or the observed Software–UK entry.
Thus the first intercept predicts million euros for Software in the UK. The Books coefficient adds million euros to the fitted value in any country, relative to Software; every other goods coefficient has this same arithmetic-difference interpretation. The country coefficients subtract , and million euros from the UK prediction for France, Germany and the rest of Europe respectively, regardless of goods. The model therefore assumes common absolute country differences across goods categories. For Software–France its prediction iswhich is impossible for positive spending and indicates a limitation of this additive original-scale specification.
The residual standard error is million euros, obtained from ; direct calculation gives . Each coefficient's printed statistic is , with a reference distribution under this normal linear model. The two-sided p-values compare each goods category with Software, or each other country with the UK, after adjustment for the other factor. For example France and the rest of Europe differ significantly from the UK at 5%, but Germany does not. The raw-scale significant goods differences are Books, Clothing, Electronic Goods, Groceries and Leisure Travel; these are individual reference-level comparisons, not an overall test of the goods factor.
The coefficient of determination is . The omnibus F-test compares all 15 nonintercept coefficients with zero:with reference and . This says at least one factor contrast is nonzero under the assumed error model. There is one observation per cell, so an unrestricted goods-country interaction would saturate the model, leaving zero residual degrees of freedom. Without replication or a specified interaction structure, the residual variation cannot be separated into interaction and independent error.
The second fit applies a logarithmic transformation and fits the same factor design to . The Gaussian log-response model isIts intercept exponentiates to a fitted Software–UK conditional median of million euros. Goods coefficients now give multiplicative ratios to Software, and country coefficients give multiplicative ratios to the UK. The estimated country ratios areFor example the Books ratio is and the Sports Equipment ratio is , consistently across countries. The model assumes common relative, rather than common absolute, country effects. It also guarantees positive retransformed fitted values. Under normal log errors, the original-scale conditional mean is , whereas is the conditional median and geometric mean. Correcting the retransformation bias here multiplies the naive predictions by approximately .
The log-scale residual standard error is , with the same 36 residual degrees of freedom, corresponding to a typical multiplicative error multiplier . France and the rest remain significant reference-country contrasts; Germany remains nonsignificant at 5%. The log-scale significant reference-goods contrasts are Books, Music, Videos/DVDs, Clothing, Sports Equipment, Electronic Goods, Groceries and Leisure Travel. Event Tickets, Toys, Video Games and Housewares do not individually differ significantly from Software at that level. These p-values remain subject to the usual multiple testing qualification.
The log-scale is computed using variation in the logarithms, so it cannot by itself establish better fit on the original response scale. The change is plausible because spending varies widely in magnitude and relative discrepancies are more meaningful than constant absolute discrepancies, but it should be assessed with regression diagnostics, especially a residual-versus-fitted plot and a normal Q-Q plot. The minimum residual near merits inspection; the command summaries alone do not verify independent normal errors. Moreover these responses are forecasts, so the inferential p-values have a literal sampling interpretation only if an appropriate stochastic model for their uncertainty is justified.
The log-scale analysis of variance adds Goods and then Country. In this balanced design their effect spaces are orthogonal after removing the intercept, so the sequential sums of squares equal the corresponding adjusted factor sums and are unchanged by reversing the two factors:The residual sum of squares is , giving . ThusTheir tiny upper-tail p-values show strong overall goods and country effects under the log-error model; a globally significant country factor is compatible with the nonsignificant individual Germany contrast. The omnibus fit statistic is on degrees of freedom, whose p-value is approximately . The printed zero reflects numerical formatting, not an exactly zero probability.
If two cell entries were missing, retain their correct factor labels and mark those responses unavailable, rather than shifting the remaining scan values into different cells. Fit the additive models to the 50 observed cells, assuming the missingness mechanism permits those observations to be analyzed without selection bias. All factor levels remain represented, and the row-column incidence graph remains connected: any two goods rows still share an observed country, since only two edges of the complete layout have been removed, and every country still has many observed goods. By identifiability of an incomplete two-factor additive design, the design therefore still has rank . HenceThe coefficients and their covariance must be recomputed by the observed-cell ordinary least squares equations. The balanced row-mean-plus-column-mean formulas and common within-factor standard errors no longer apply. Goods and Country effects are generally no longer orthogonal, so sequential ANOVA sums can depend on order; factor tests adjusted for the other factor should use nested model comparisons. Missing cells do not restore replication or make an unrestricted interaction test possible: that larger model still fits every observed cell exactly. If missingness depends on the unavailable spending values, additional modelling of that mechanism would be needed.
Use the time-homogeneous continuous-time multi-state model displayed in part ii. Write for the state at time , for its generator matrix, andFor , is the transition intensity, and . Condition on the observed initial state, and treat the clinic observation process and administrative end of follow-up as noninformative. A panel-observed interval contributes its transition probability, not the density of a jump at the examination date; the transitions inside that interval need not have been observed.
For the first patient, the two clinic intervals contribute . The subsequent death is observed at elapsed time after the last clinic state, so its contribution is the conditional death-time densityThe equality uses the permitted directions: starting from state 3, only living states 3 and 4 can be occupied before death. To obtain this density directly, survival in a living state until time , followed by death in , has probability ; add over the unobserved state . Hence the mixed panel and exact-death likelihood contribution isIt includes the possibility of an unrecorded transition between the last clinic visit and death. Keeping only would exclude that allowed history, while would be the probability of death by that time rather than the density of death at that time. With dates recorded in whole days, an exact interval-likelihood treatment integrates this density over the relevant day; the density formulation is its fine-time approximation.
For the second patient, the three successive intervals with state 1 at both ends, then the interval ending in state 2, and the last interval remaining in state 2 give the panel-observed multi-state likelihoodThere is no additional death contribution after the final administrative observation. Each likelihood contribution already accounts for being alive in the observed state at that visit. For independent patients their joint conditional likelihood contribution is .
For an explicit form, put . Irreversibility givesandThese formulas follow by integrating the density of the one possible intermediate jump time; at equal exit rates the limiting expression is . ThusUsing the displayed fitted rates as numerical values gives per year, per year and , providing a check of the probability-versus-density distinction.
The permitted transitions form the following diagram. Each arrow is labelled by its fitted transition intensity in units of inverse years; the absence of an arrow is a structural restriction, not an estimated small effect.
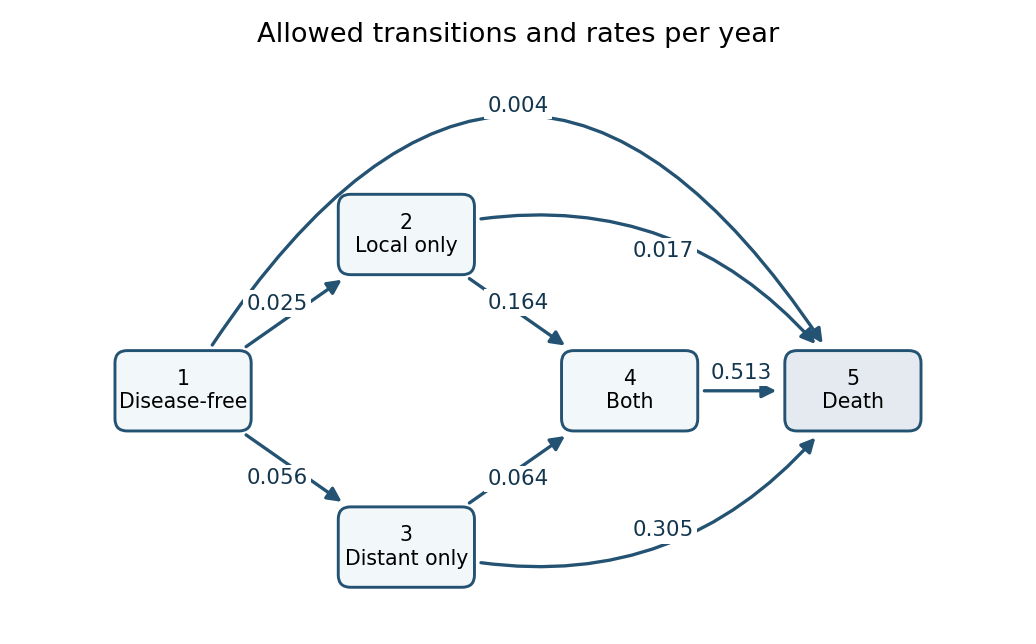

State 1 can move directly to 2, 3 or 5; state 2 can move to 4 or 5; state 3 can move to 4 or 5; and state 4 can move only to 5. There are no recovery transitions, and state 5 is an absorbing state. The rates of leaving the four living states are the sums of their outgoing arrows:The diagonal generator entries are their negatives, so every row of sums to zero. These diagonal entries are not arrows or negative event rates. For example the direct rate is per year, while death after reaching another state can occur at a much larger rate. The printed fit has no covariates on the intensities, so it estimates one pooled rate system and contains no treatment-effect comparison, despite the trial's treatment randomization. The reported describes the fitted likelihood level; by itself it is not a goodness-of-fit test without a reference or competing model.
For a homogeneous continuous-time Markov chain, the holding time in a living state before the next transition has survival probability , where . Indeed, conditional on still occupying that state, the probability of leaving in the next is , so its survival function satisfies and . Integrating gives the mean holding time from a transition intensity matrix:This is the mean time until any allowed exit from that state, not necessarily the patient's remaining lifetime.
For confidence limits, use the supplied standard error of the corresponding diagonal generator estimate. Changing its sign does not change its standard error, so it is also the standard error of . The delta method, with derivative , givesThe resulting approximate 95% Wald confidence intervals areThe diagonal standard errors already incorporate the covariance among outgoing rates. They should not be replaced by the square root of a sum of squared off-diagonal standard errors, which would silently assume those rate estimates independent.
Alternatively construct a positive rate confidence interval and apply the confidence interval for an inverse rate transformation. Here every normal rate interval has a positive lower endpoint, givingThese approximate intervals are, respectively, , , and years. They are asymmetric because inversion is nonlinear; positive log-rate or likelihood-based intervals could also be inverted. The symmetric delta intervals and the inverted-rate intervals are two legitimate first-order approaches and need not have numerically identical endpoints.
The death state has zero exit rate, so its holding time is infinite. There is no finite mean-sojourn estimate or ordinary finite confidence interval for this structurally absorbing state. All intervals above concern the mean parameter, not a prediction interval for one patient's realized holding time.
The transition matrix over five years is . Its first row conditions on starting in state 1. The displayed approximate probabilities mean that, five years later, about 65% remain disease-free, 6% have local recurrence only, 10% have distant metastasis only, 2% have both, and 16% have died. They are probabilities of the states occupied at five years; they are not the probabilities of the next jump destinations or annual transition intensities. In particular the positive probability of state 4 does not require a direct arrow: the paths and contribute to it. The probability of death includes deaths after any allowed sequence of intermediate states.
The printed row sums to rather than one because the entries are approximate; an exact stochastic transition row sums to one. Exponentiating the displayed three-decimal generator gives approximately , illustrating that the edited, low-precision table should not be treated as an exact matrix exponential of its separately rounded rates.
State 5 is an absorbing state, so once entered it can never be left. Its generator row is zero, and the last row of every positive-time transition matrix is thereforeThis explains all four leading zeroes in the printed last row.
Articles by others on the same topic
There are currently no matching articles.