The standardized observations are independent standard normal random variables. By the definition of the chi-squared distribution,Its distribution is continuous, so gives the required probability. Put . Solving for the positive variance reverses the reciprocal order. The exact confidence interval isThe mean is known to be zero, so the degrees of freedom are , not . Coverage is exactly under the stated normal model.
The Neyman-Pearson lemma compares two simple hypotheses with densities . Among all tests of size at most , a most powerful test rejects when , accepts when it is below , and may randomize on equality to attain the prescribed size. The threshold and any boundary randomization are chosen so the rejection probability under is .
The key inequality is pointwise for the likelihood-ratio test . Integration shows its power is at least that of any competing test with no larger size. With continuous likelihood-ratio statistics, boundary randomization is unnecessary.
For , the likelihood ratio in favor of the larger variance isBecause , this is strictly increasing in . The Neyman-Pearson lemma therefore selects an upper-tail rejection region. Under the null, , so size is obtained withContinuity of the chi-squared distribution makes the boundary have probability zero. This is a fixed-mean normal variance test.
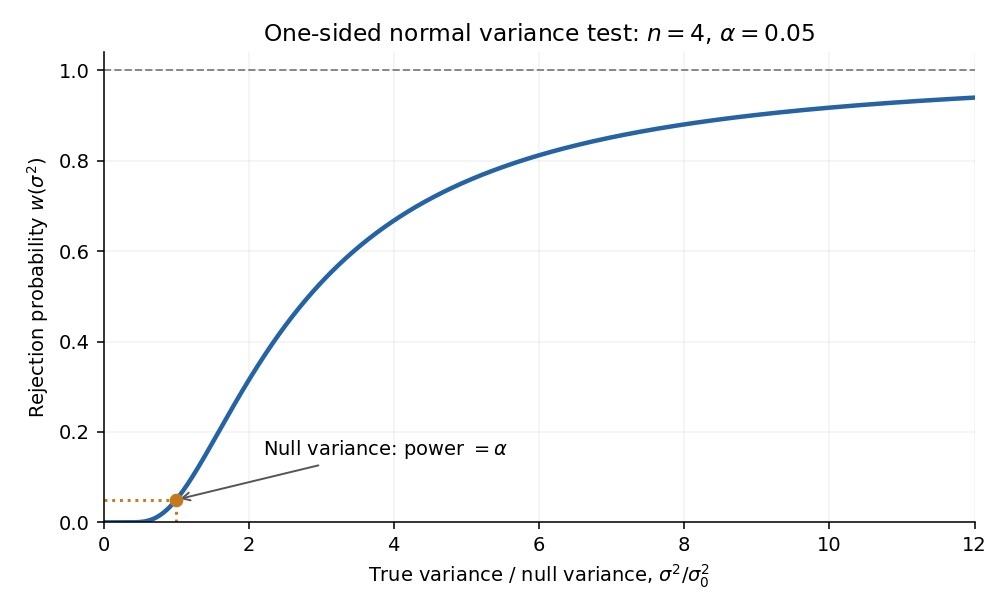
Yes, it is a uniformly most powerful test for the one-sided alternative. For every fixed , the likelihood ratio is increasing in the same statistic . The size- threshold found in part (c) depends only on the null variance and , not on the selected alternative variance. Thus one and the same test is most powerful against each simple member of the composite alternative, which is exactly uniform most powerfulness.
At a true variance , . Therefore the power function isThe argument of decreases as increases. Since the chi-squared density is positive on the positive half-line, the power is continuous and strictly increasing, withThese features determine the requested rough sketch. The curve passes through the size at the null value and approaches one for very large variance.

Articles by others on the same topic
There are currently no matching articles.