Here , , , and , in the stated reservoir units. The exact characteristic coefficients are and , givingThe leading separation estimates give yr and yr if finite is retained, or yr if is also sent to infinity. Thus ; a ratio of ten warrants using the exact values for the requested sketch.
Assume initially zero anomalies in all reservoirs. The atmospheric impulse response, obtained by decomposing into the three normal modes, iswith , , and , in ppmv/GtCO. The checks and fix the instantaneous injection response and its initial decay.
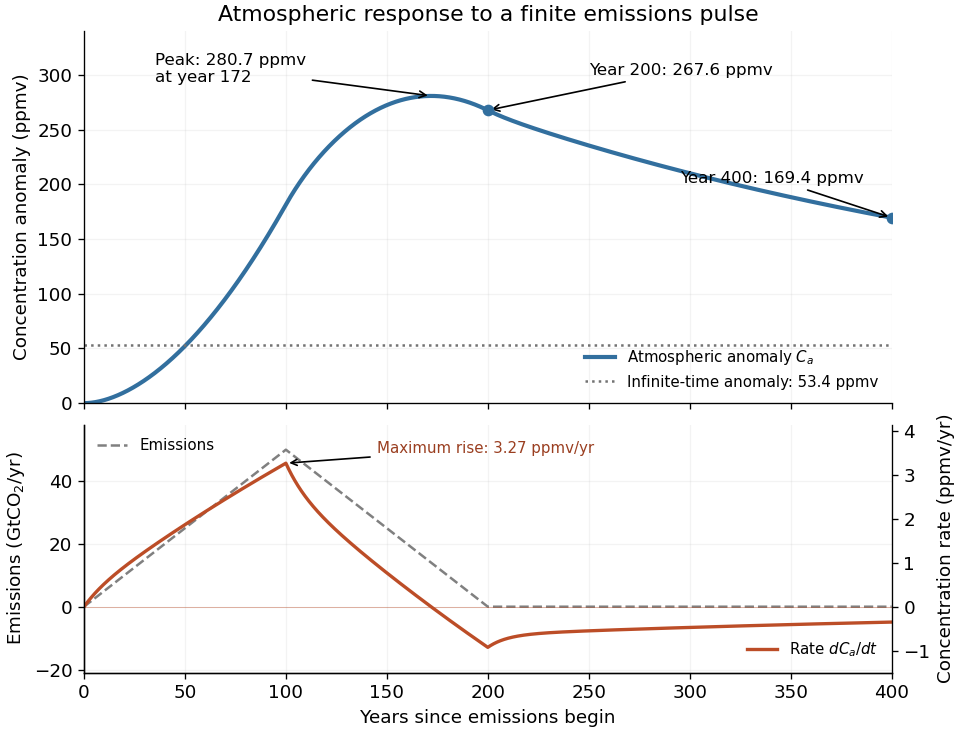
The concentration is the convolution . To evaluate it transparently, define for , andsetting every when . Expressing the triangular emission history as givesHere times are in years and has the corresponding emission-ramp units. Differentiating or evaluating the convolution givesThe maximum concentration occurs earlier than the end of emissions, at approximately year , with ppmv. Initially there is a short adjustment over ; the curve then rises, turns over as emissions fall, and continues declining after year 200 as the deep ocean takes up carbon dioxide.
The total emitted mass is the area of the emission triangle, GtCO. All reservoirs eventually share one concentration, so conservation of mass gives

Articles by others on the same topic
There are currently no matching articles.