Choose the illustrative local modelHere is the Celsius temperature, measured relative to , so is dimensionless. For this chosen affine function, the derivative and inverse relation areCalculated values are , , , and . These are model outputs, not measurements or an assertion that any real Pt100 follows this line exactly. The number here is the chosen slope parameter; it is not a universal local derivative for all platinum resistance thermometers. Curvature, manufacturing differences, and the fitted calibration interval matter. A wider-range calibration uses a validated response curve rather than extrapolating this line indefinitely.
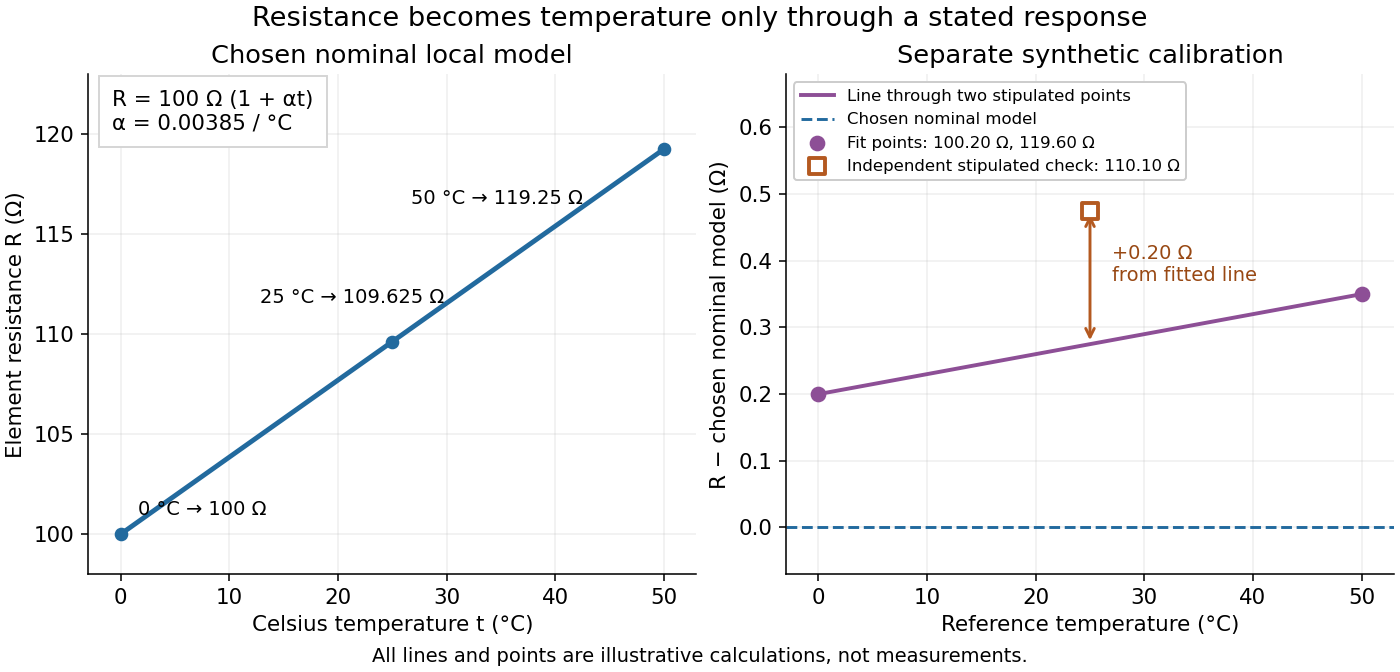
Chosen Pt100 line and an illustrative calibration with an independent check
. The left panel plots the Pt100 local linear model. The right panel uses stipulated values for a different illustrative element: two points set a line, while a third point tests it. Every point is synthetic; none is measured calibration data or a tolerance band. Source. Details.
For a separate synthetic thermometer calibration, stipulate at and at . A two-point affine function has slope and givesThus would indicate . If an additional synthetic check at reference instead supplied , the line would indicate . The residual exposes disagreement that two fitted points cannot reveal. This separate example changes both offset and slope; it is not a replacement specification for the nominal Pt100 local linear model.
Articles by others on the same topic
There are currently no matching articles.