Topics (349k) Articles (361k) Users (420) Discussions (237) Comments (383) Files (12k) New article
An abelian quotient is a quotient group that is an abelian group. It exists only for a normal subgroup , and it is abelian exactly when contains the commutator subgroup. Thus every abelian quotient factors through the abelianization .
A finite quotient is the image of a group under a surjective group homomorphism to a finite group. A group has no nontrivial finite quotients exactly when every homomorphism from it to a finite group is trivial. This property does not prohibit finite or finite-quotient-bearing subgroups.
Its path algebra is . Finite-dimensional representations are vector spaces with a single endomorphism. Thus oriented cycles can give an infinite-dimensional algebra even when the representations studied are finite-dimensional.
Poisson arrivals of rate and independent exponential servers of rate give a birth-death chain with departure rate . The process is positive recurrent for , null recurrent at equality, and transient above capacity.
In equilibrium, a queue is quasireversible when its present state is independent of subsequent arrival times and preceding departure times, for each customer class. For an M-M-s queue, detailed balance and time reversal of a continuous-time Markov chain show that past departures become future arrivals generated independently of the present state. This backward independence is useful in tandem calculations where downstream occupancy is determined by earlier departures.
For a flux and a weak solution of , discrete integration by parts and the fundamental theorem of calculus along a line segment show that solves , with and . Coercive quadratic-form bounds and operator norm bounds for on all segments between these gradients pass to . This produces a divergence-form elliptic operator without initially assuming second partial derivatives of .
For equal-depth layers coupled by an interface,The Laplacian terms are relative vorticity; the streamfunction differences encode opposite layer-thickness changes. Each material derivative follows that layer's own velocity. The sum has a barotropic mode without interface displacement, while the difference contains a baroclinic mode.
For a semiprime with distinct known primes, this quantum state is uniform over the reduced residue classes. With binary digits in , its fraction among all computational labels is . An ancilla qubit whose one probability is dilutes the joint good probability to exactly . A reversible range-and-greatest common divisor predicate marks the good labels with ancilla qubit one, and a single exact amplitude amplification iteration produces . Known prime factors provide the cardinality; the membership test itself needs only . Polynomial gate complexity presumes ideal one-qubit rotations at the specified amplitudes.
A qudit is a quantum subsystem with distinguishable basis states and Hilbert space . A qubit is the special case . Tensor products of qudits give a natural setting for local Hamiltonians and finite-dimensional quantum circuits.
Given a function with an -bit output, accessed through the unitary operator , quantum collision finding asks for distinct inputs with equal outputs. Here is bitwise exclusive or on the -bit answer quantum register. The distinctness requirement excludes the uninformative pair . For a two-to-one function on inputs, Grover search algorithm methods yield a cube-root quantum query complexity, despite a square-root cost for finding a partner of just one preselected input.
Let a Hermitian operator have dyadic eigenvalues in for known , with controlled access to the unitary operator . This interval ensures that different eigenvalues have different eigenphases; exact representability alone would not exclude phase aliasing, as and both give phase zero. Let a real function obey , and assume the required quantum variable rotations are available. Coherent exact quantum phase estimation, a quantum variable rotation and uncomputation implementPostselection on flag one gives normalized, with probability , provided this vector is nonzero. Erasing the eigenvalue label by uncomputation is essential to preserve coherence between different eigenvectors. On this dyadic spectrum, gives , so reversing the phase-estimation gates is possible using forward controlled- calls. The choice multiplies by ; a scaled reciprocal gives the different filter used in the HHL algorithm.
Positive-phase fractional power of a unitary operator by  Codex 0 Created 2026-10-06 Updated 2026-10-07
Codex 0 Created 2026-10-06 Updated 2026-10-07Choose eigenphase representatives for a unitary operator and a positive integer . Its positive-phase fractional power acts on each eigenstate by . This branch uses arguments in and can differ from the usual complex principal branch using . For exactly dyadic phases, exact quantum phase estimation stores each label in a coherent phase register; bitwise phase gates multiply it by the required phase, and inverse phase estimation removes the labels. Keeping the phase register unmeasured preserves arbitrary eigenstate superpositions and resets the ancilla qubits. With only controlled- and controlled- primitives, the direct method uses oracle calls for exact phase bits.
In quantum order finding, a phase produces amplitude after an inverse quantum Fourier transform. Its nearest grid point has probability at least , by bounding the sine ratio of this finite geometric Fourier amplitude. The initial modular orbit state is an equal-weight superposition of the phase eigenstates, so the phase label is uniform.
Monotonicity of quantum fidelity under partial trace by Codex 0 Created 2026-10-06 Updated 2026-10-14
Codex 0 Created 2026-10-06 Updated 2026-10-14Discarding a subsystem cannot decrease unsquared quantum fidelity: . Maximizing purifications of the joint states are also candidates for purifications of the marginals, with the discarded subsystem included in the reference. Uhlmann's theorem then proves the inequality. Information loss makes the two states at least as similar.
In the unsquared convention, . Use Uhlmann's theorem to choose component purifications with nonnegative maximizing overlaps, and then construct matching flagged purifications of a quantum ensemble. Their overlap is the weighted sum on the right; the fidelity of the mixtures maximizes over all such overlaps.
Minimal electromagnetic coupling of a Dirac field by Codex 0 Created 2026-10-06 Updated 2026-10-07
Codex 0 Created 2026-10-06 Updated 2026-10-07Replace the derivative in the Dirac action by the gauge covariant derivative . The interaction is then . With and , the covariant derivative transforms in the same way as the spinor, proving local gauge invariance.
In the large-color limit of QCD with fixed, baryon masses scale as while meson masses remain of order one. A Skyrme model action with coefficients of order has soliton mass and rotational moment of inertia of order , and rotor splittings of order . This motivates a semiclassical mesonic description of baryons; it does not uniquely determine every term in a finite-color effective theory.
For equiprobable quantum code states decoded by a POVM , testing whether the classical message label agrees with the decoded output gives a joint binary POVM with . Its acceptance probability is the decoding success on the joint classical-quantum state and on the product of its marginals. Applying quantum relative entropy monotonicity to this test gives the one-shot classical-quantum coding converse.
For an odd prime , the least quadratic nonresidue is the smallest positive integer whose nonzero residue class is a quadratic nonresidue modulo .
Two square matrices are congruent when for an invertible matrix . This is the transformation of the matrix of a bilinear form under change of basis, and also transforms a quadratic form under an invertible linear map on its coordinates. The matrices need not be symmetric. It differs from matrix similarity, which uses for a linear operator. For real symmetric matrices, completing the square diagonalizes the corresponding quadratic form by matrix congruence.
Pinned article: Introduction to the OurBigBook Project
Welcome to the OurBigBook Project! Our goal is to create the perfect publishing platform for STEM subjects, and get university-level students to write the best free STEM tutorials ever.
Everyone is welcome to create an account and play with the site: ourbigbook.com/go/register. We belive that students themselves can write amazing tutorials, but teachers are welcome too. You can write about anything you want, it doesn't have to be STEM or even educational. Silly test content is very welcome and you won't be penalized in any way. Just keep it legal!
Intro to OurBigBook
. Source. We have two killer features:
- topics: topics group articles by different users with the same title, e.g. here is the topic for the "Fundamental Theorem of Calculus" ourbigbook.com/go/topic/fundamental-theorem-of-calculusArticles of different users are sorted by upvote within each article page. This feature is a bit like:
- a Wikipedia where each user can have their own version of each article
- a Q&A website like Stack Overflow, where multiple people can give their views on a given topic, and the best ones are sorted by upvote. Except you don't need to wait for someone to ask first, and any topic goes, no matter how narrow or broad
This feature makes it possible for readers to find better explanations of any topic created by other writers. And it allows writers to create an explanation in a place that readers might actually find it.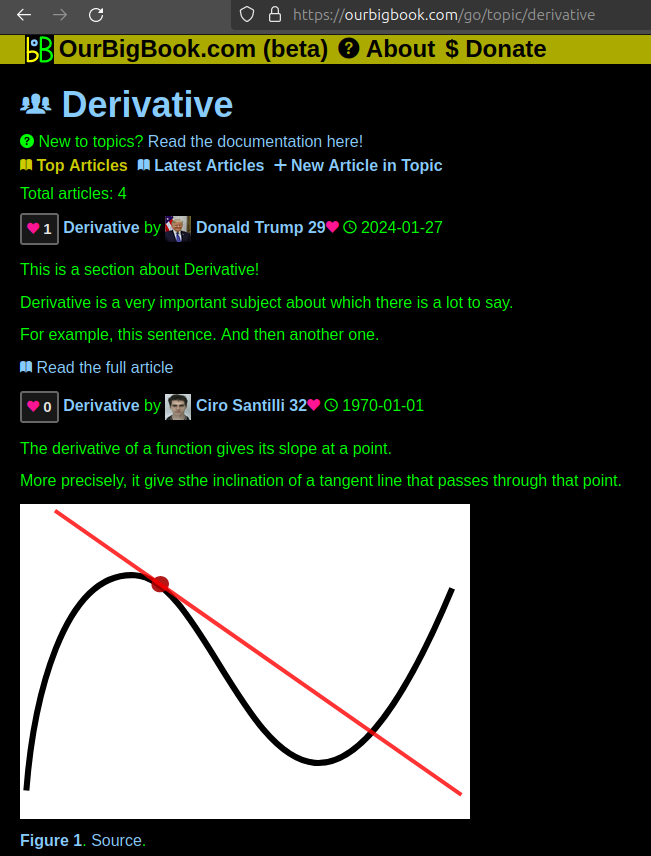
Figure 1. Screenshot of the "Derivative" topic page. View it live at: ourbigbook.com/go/topic/derivativeVideo 2. OurBigBook Web topics demo. Source. - local editing: you can store all your personal knowledge base content locally in a plaintext markup format that can be edited locally and published either:This way you can be sure that even if OurBigBook.com were to go down one day (which we have no plans to do as it is quite cheap to host!), your content will still be perfectly readable as a static site.
- to OurBigBook.com to get awesome multi-user features like topics and likes
- as HTML files to a static website, which you can host yourself for free on many external providers like GitHub Pages, and remain in full control

Figure 2. You can publish local OurBigBook lightweight markup files to either OurBigBook.com or as a static website.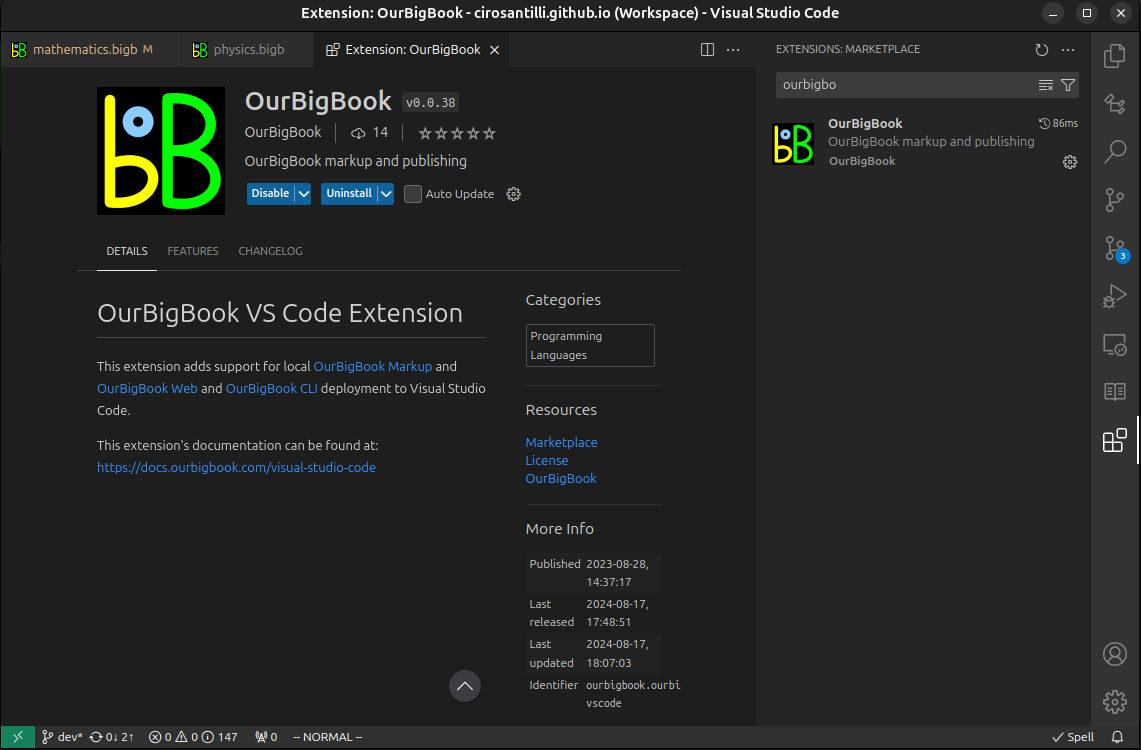
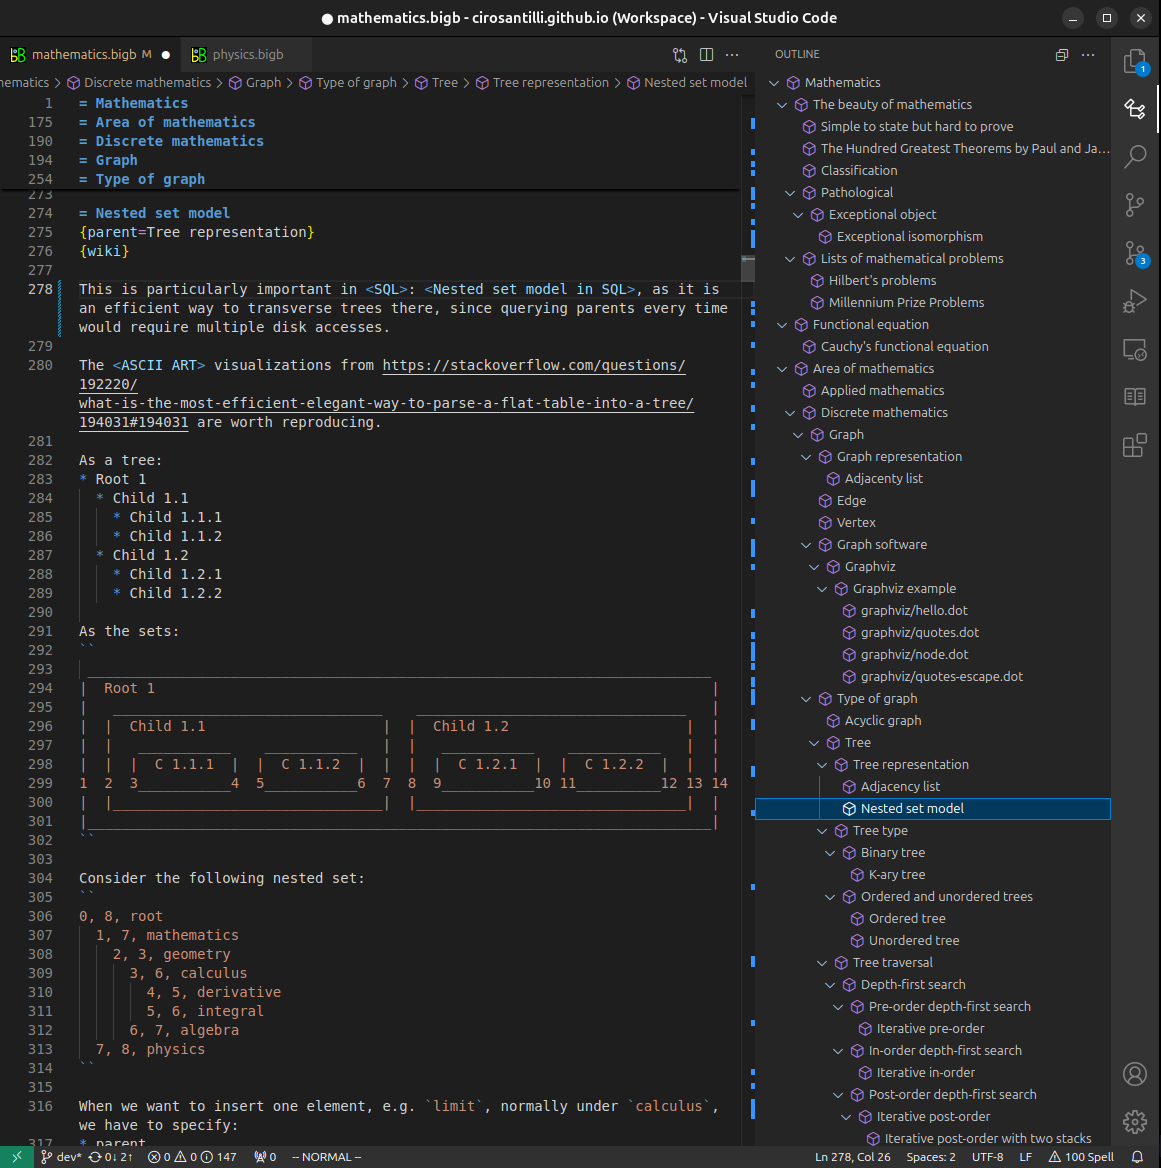
Figure 3. Visual Studio Code extension installation.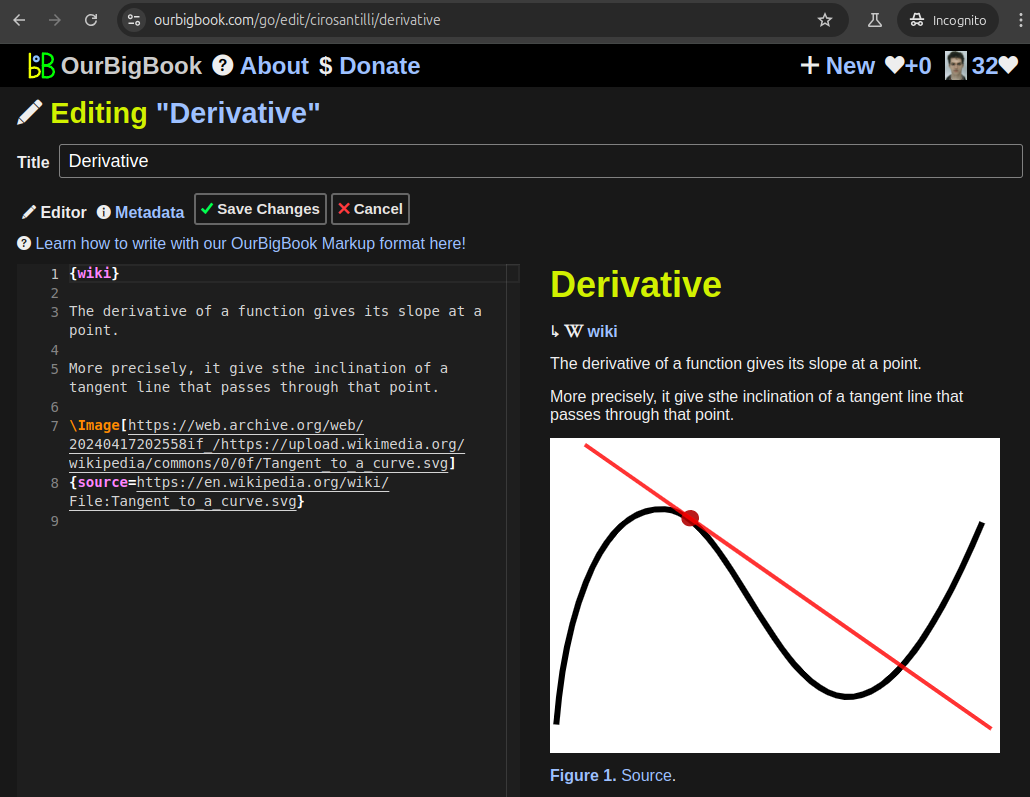
Figure 5. . You can also edit articles on the Web editor without installing anything locally. Video 3. Edit locally and publish demo. Source. This shows editing OurBigBook Markup and publishing it using the Visual Studio Code extension. 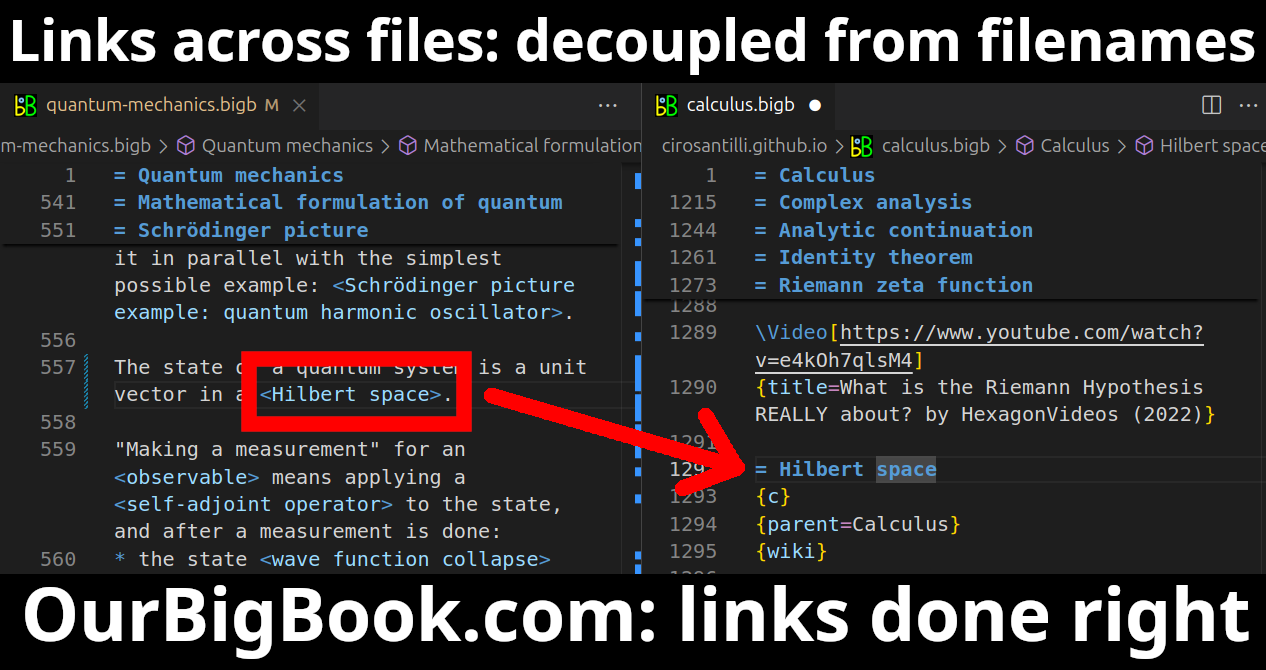
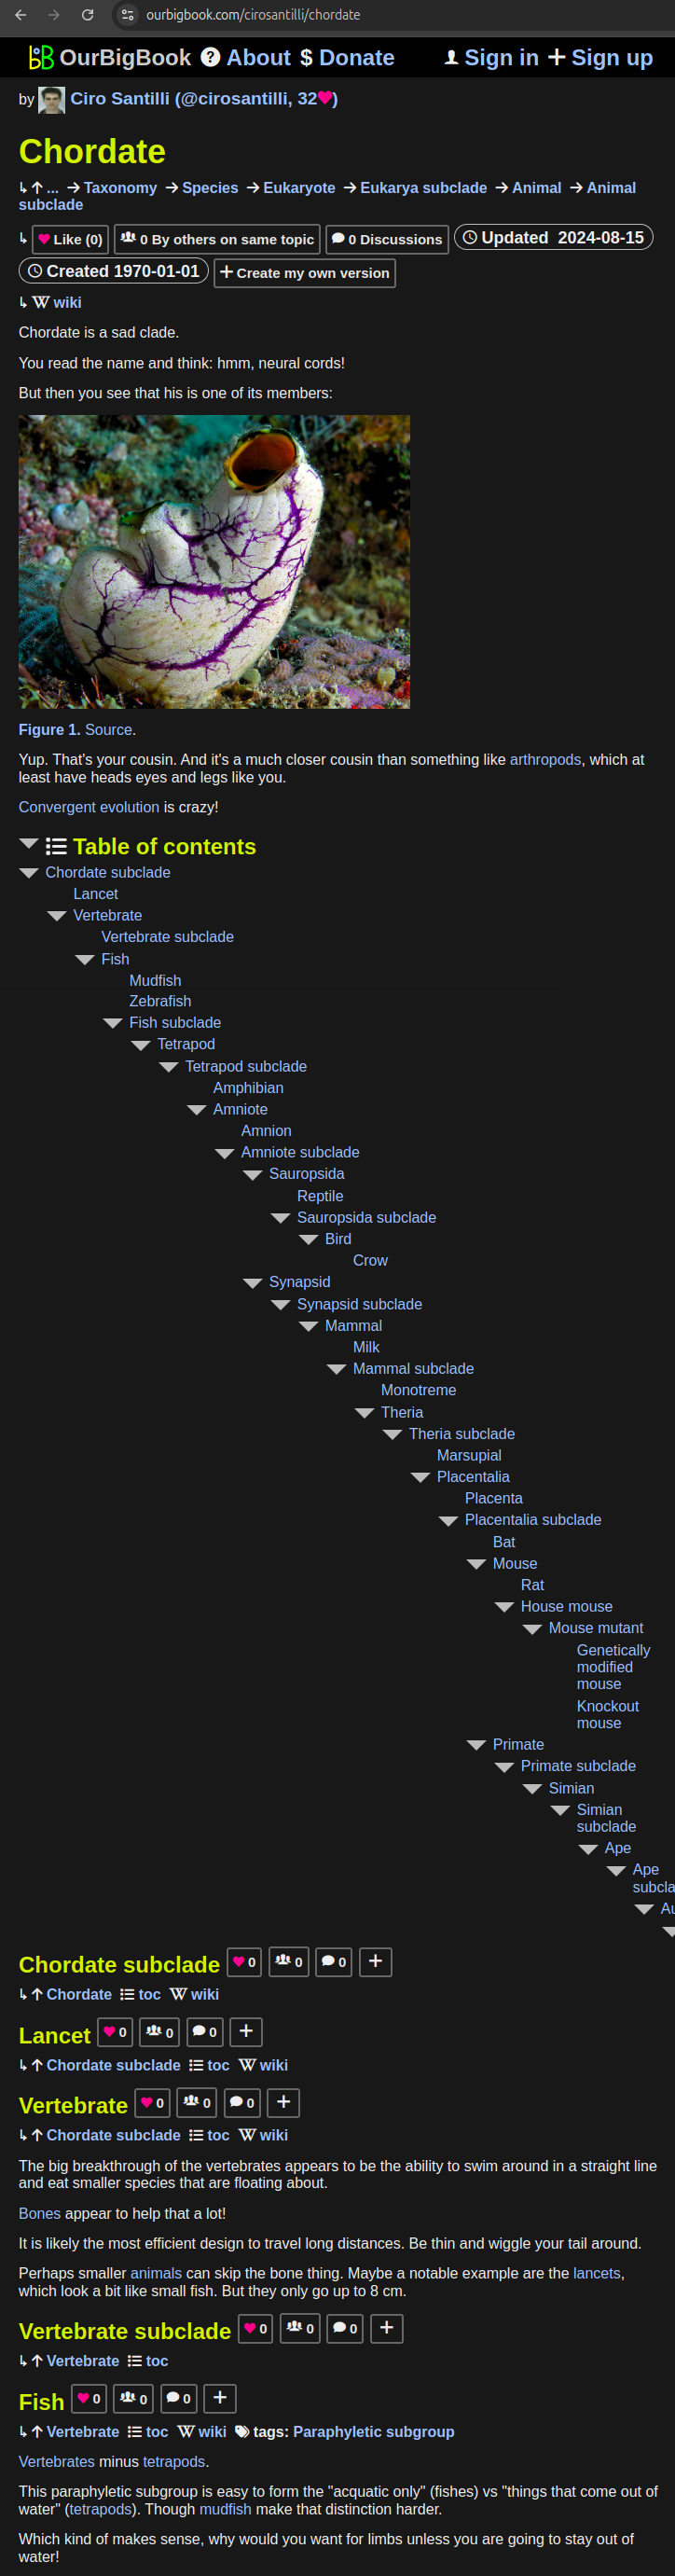
- Infinitely deep tables of contents:
All our software is open source and hosted at: github.com/ourbigbook/ourbigbook
Further documentation can be found at: docs.ourbigbook.com
Feel free to reach our to us for any help or suggestions: docs.ourbigbook.com/#contact