
For the transmitted S wave in sandstone, Snell law for elastic waves givesThe different transmitted P- and S-wave angles result from their different seismic velocities, despite their common horizontal seismic ray parameter.
The transmitted P wave travels in the sandstone. Conservation of the seismic ray parameter givesIt bends toward the vertical because its seismic velocity is smaller.
For a horizontal interface, Snell law for elastic waves conserves horizontal seismic ray parameter . At the limestone–sandstone interface the incident P wave has . The reflected S wave remains in the limestone, sofrom vertical. All angles below use this normal-to-interface convention.
Potential leakage paths are permeable or reactivated faults and connected fractures cutting the sealing sequence; lateral migration through connected reservoir layers into an unsealed outcrop or spill point; and natural or artificial penetrations such as poorly sealed abandoned wells or a compromised injection well. Injection raises pore pressure, potentially overcoming the capillary entry pressure of a seal, hydraulically opening fractures, or causing fault reactivation through reduced effective stress.
Seal continuity and porous permeability matter more than the rock name alone: a fractured or porous limestone need not be an effective caprock. Dissolution, chemical alteration or well-cement degradation can change leakage pathways over time. The underlying salt may be an effective barrier beneath the reservoir, but it does not seal the roof. Conversely, dissolved or residually trapped carbon dioxide is less mobile than a connected buoyant free-fluid phase, so connected porosity and fluid state also affect leakage.
Recommend a three-dimensional multichannel seismic reflection survey, with enough areal aperture, offsets and repeated coverage to image the reservoir top, base, structure and possible leakage faults. A two-dimensional reconnaissance line can be cheaper but cannot map a three-dimensional closure reliably and is vulnerable to out-of-plane reflections. Use seismic migration to position dipping reflectors and faults; repeatable acquisition is desirable if later carbon capture and storage monitoring is intended.
A tuned marine marine air-gun array supplies broadband low-frequency seismic wave energy that can penetrate to . Its trade-offs include bubble oscillations, seismic source ghosts, environmental constraints and limited high-frequency resolution. Sparker seismic source and boomer seismic source sources can provide higher-frequency, high-resolution shallow imaging, but commonly lack the energy and low frequencies needed to make them the first choice for this target. Source energy, bandwidth and repeatability must be balanced against penetration and vertical seismic resolution, approximately ; at and this is about . Required resolution ultimately depends on the unknown reservoir thickness.
A towed hydrophone streamer efficiently records pressure over many channels while a vessel moves. It primarily records P-wave pressure in the water, with flow noise, tow-depth ghosts, acquisition footprint and access restrictions as limitations. Seabed multicomponent nodes use hydrophones and geophones: pressure plus three-component ground motion can separate wavefields and recover converted S-wave information, and nodes permit wide azimuths and repeat surveys. Their costs include deployment, retrieval, coupling and positioning. Direct S waves do not propagate through the water column. The roughly water depth also creates a strong short-period water-layer seismic multiple that must be treated in processing.
The sandstone records deposition of transported sand, followed by burial and cementation. For the Bunter setting, river channels, floodplains with channel sands and arid continental dune systems are plausible environments; a sandstone name alone does not uniquely distinguish them. Well-sorted or weakly cemented sand can retain the connected porosity and porous permeability needed for a saline aquifer.
The Zechstein evaporite suggests restricted marine basins or salinas in an arid climate, where evaporation concentrates seawater until dissolved salts precipitate. Repeated restriction and replenishment can build thick evaporite sequences, including rock salt. The Triassic limestone indicates carbonate accumulation, plausibly in warm, shallow marine settings with limited siliciclastic supply, followed by cementation. Some limestones can also form in lakes; the marine interpretation here uses the stated regional sequence.
For the same geometry, field strength and induced magnetization model at the opposite magnetic inclination, replacing by gives . Thus the north–south asymmetry reverses: the principal low moves to the northern side and the high to the southern side. It is a horizontal reflection of the simple profile, rather than a necessary reversal of every anomaly's sign. At a magnetic pole the induced anomaly is symmetric; at the magnetic equator the symmetry is different again. If remanent magnetization dominates, a hemisphere change alone does not determine the new profile because that remanence direction also has to be specified.
Assume the greenstone belt is more magnetically susceptible than the host rocks and granite, its magnetization is mainly induced magnetization, and the body is roughly east–west elongated so that the south–north line crosses it. At southern magnetic latitudes the main field has negative magnetic inclination in a north-and-down coordinate convention. The total-field magnetic anomaly is then generally asymmetric: the principal negative lobe is on the southern side and the positive lobe is displaced northward for the simple induced source illustrated here. The exact lobe sizes and peak positions depend on body geometry and the actual magnetic inclination.[ref]
Magnetic line profiles by UBC Geophysical Inversion Facility. Examples 1–2: the low lies north at northern inclination and south at southern inclination
An explicit sketching model is an induced magnetic dipole at depth . With northward coordinate , and unit field direction , its normalized total-field magnetic anomaly isThe plot uses only as an illustrative dipole-field inclination for a latitude near south, not a measured modern field at the site. A wide greenstone belt would broaden the response and can produce prominent edge anomalies. Remanent magnetization or a magnetic granite could change the sketch substantially; gravity alone cannot identify the magnetic source.
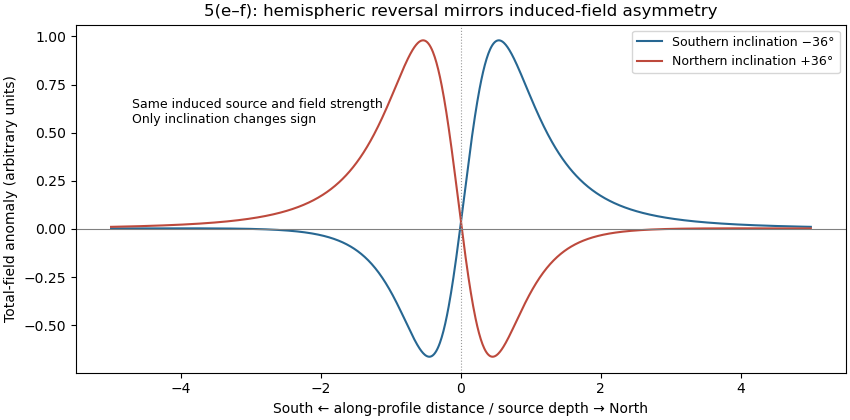
Induced-source magnetic anomalies for opposite inclinations on a south–north profile
. Details. 
Measure total magnetic field along the same south–north line with a calibrated magnetometer, recording position, time and sensor height. A simultaneous base-station magnetometer measures temporal variation so that diurnal changes can be removed from the moving survey. Avoid disturbed periods and magnetic contamination from vehicles, fences, power lines and equipment. Choose station spacing much smaller than the expected anomaly width, for example tens to hundreds of metres for a kilometre-scale target.
Subtract the epoch-appropriate International Geomagnetic Reference Field or another stated regional main-field model to obtain a total-field magnetic anomaly. Level overlapping traverses and remove offsets or drift where appropriate. Accurate terrain/sensor geometry is needed for comparison with a geological model, but there is no universal magnetic analogue of a constant-density Bouguer slab correction: the effect depends on the distribution and direction of magnetization. Measure magnetic susceptibility and remanent magnetization on representative greenstones, granite and host rock to test the assumed magnetic sources.
Retain the same regional-background assumption as in part (b). The northern pluton is about thick beneath the station near the northern trough, while its gravity anomaly is about . Its anomaly relative to the greenstone maximum is approximately . Therefore the contrast equation isUsing the result of part (b), the second term contributes , leaving a net pluton anomaly of about . Hence , effectively close to the host-rock density at the precision of this diagram.
The apparent trough is strongly negative relative to the greenstone belt, but hardly negative relative to the southern host-rock background. If a northward regional trend is intended instead, it must be stated: in general,with both gravity values in milligals. For example, a northern background of would give , but the same reference would also change part (b). No regional curve is explicitly identified in the supplied figure, so the numerical result must retain its reference-field assumption. This is the geological nonuniqueness of geophysical inversion of potential-field interpretation, rather than a reason to force a presumed textbook granite density onto the plot.
For a laterally extensive Bouguer slab of thickness and geophysical density contrast ,The greenstone belt reaches from roughly to near its deepest central part, so use . The gravity maximum is approximately ; the exposed host-rock background in the south is approximately . Taking this as a constant regional reference gives a local excess . ThusThis is an approximate density under a constant-background, infinite-slab model. The finite width, variable thickness and neighboring pluton require a fuller gravity inversion for a precise value. In particular, the absolute value must not be inserted as the local excess.
A gravity anomaly is measured gravitational acceleration, reduced to a stated reference surface and compared with a reference gravity field. A local geological interpretation further removes or models the regional background. An absolute negative Bouguer gravity anomaly is therefore not itself a local negative geophysical density contrast.
Measure relative gravity with a calibrated gravimeter at stations across the profile, tie it to a base station, repeat base readings to estimate instrumental drift, and measure station coordinates and accurate elevations, for example by GNSS and levelling. Record observation times for tide corrections. Subtract the latitude-dependent reference gravity, correct instrument drift and Earth tides, add the free-air correction for station height, and subtract the attraction of the reference-density Bouguer slab. A terrain correction accounts for relief missing from or exceeding that slab. Use a consistent density such as for the topographic correction.[ref]
Geophysical Data Grids for the Conterminous United States by United States Geological Survey. Gravity anomaly reduction: free-air, simple-Bouguer and complete-Bouguer corrections
Use repeat-pass interferometric synthetic-aperture radar. An orbiting radar transmits coherent microwave pulses and records the amplitude and phase of the returning field. Form an interferogram from registered complex images acquired before and after the earthquake, remove the orbital contribution and the topographic phase predicted by a digital elevation model, and correct atmospheric and other long-wavelength phase delays. Where interferometric coherence is adequate, unwrap the residual phase to estimate line-of-sight displacement:with sign set by the instrument's displacement convention. Each phase cycle represents of range change.
This maps a distributed earthquake displacement field day or night and through cloud, including areas inaccessible on foot. Roughly – ground sampling and a scene spanning many kilometres on both sides of the fault can resolve regional deformation; a narrow surface break benefits from finer pixels or complementary sub-metre optical surveys. Sensitivity to displacement can be millimetres to centimetres in coherent areas, but that does not equal spatial resolution. A single viewing direction measures one component; ascending and descending tracks and GNSS constrain more components. At the rupture itself, large gradients and changed ground cover can destroy interferometric coherence; radar pixel-offset tracking or before/after optical correlation can then recover metre-scale fault offsets.
There are unlisted articles, also show them or only show them.