
The star is near the southwestern end of the main fault slip patch, so a much longer part of the finite-source rupture propagates northeastward. For comparable distances, ground conditions and buildings, the northeastern site receives the stronger, shorter direct pulse; the southwestern site receives the weaker, longer direct shaking. This is rupture directivity.[ref]
What is Directivity by United States Geological Survey. Explanation of focusing by successive rupture elements
For a segment of length , rupture velocity and seismic wave speed , successive arrival times span approximatelyForward arrivals overlap and concentrate energy into a shorter pulse. Backward arrivals spread out. The supplied finite-source rupture is not perfectly unilateral, so the prediction concerns the dominant contribution. Seismic radiation patterns, seismic attenuation, sediment amplification and building response can alter the ranking of actual damage or total coda duration.
Effective stress and frictional strength generally increase with depth through the shallow crust undergoing brittle fracture. At , small overburden and often weak, fractured near-surface materials limit the shear stress and elastic energy that can accumulate. Some shallow materials also undergo stable sliding rather than unstable earthquake nucleation. Near , a locked fault prone to brittle fracture can sustain a much larger differential stress before frictional instability releases stored elastic energy.
This depth is plausibly near the lower, strong part of the seismogenic layer: below it, increasing temperature eventually promotes material creep across the brittle-ductile transition. Once nucleated at depth, a dynamic finite-source rupture can propagate into shallow regions that could not independently nucleate the same event. Depth alone does not determine the nucleation point: local pore pressure, frictional stability and stress heterogeneity also matter.
For a heterogeneous fault slip distribution, seismic moment iswhere is the shear modulus, the fault plane area, and the area-averaged fault slip. The peak colour cannot be used as : most of the illustrated fault plane has much smaller fault slip.
One reproducible graphical estimate divides the approximately long and down-dip panel into seven strips and a final strip. Reading area averages from the colour scale, from southwest to northeast, gives roughly . This includes the pale, nearly unslipped lower part of each strip. Henceand . A reasonable graphical range is approximately –, dominated by colour averaging and the down-dip extent of small fault slip. The corresponding moment magnitude is about , using . This is an estimate from the supplied distribution, rather than a substitution of a catalogued earthquake magnitude.
Treat the two strands as newly formed conjugate faults obeying the same Mohr-Coulomb failure criterion, rather than merely inherited faults reactivated in a later stress field. A fault strike is an unoriented line, so is equivalent to . The acute angle between the fault strikes is therefore . The formal compressive acute bisector puts at azimuth and at . This orientation must also be checked against the mapped senses of strike-slip faulting, as discussed below.
Let be the angle between either fault plane and . Tangency of Mohr's circle to , where is effective stress normal to the plane and is cohesion, gives and . ThusIn the Mohr circle, the fault planes are apart around the circle, because a physical plane rotation is doubled. The figure uses to display both tangencies; a common nonzero cohesion changes the intercept, not the inferred friction angle. The inference of requires optimally oriented conjugate faults at formation: the two fault strikes alone cannot measure a friction coefficient for arbitrarily reactivated faults.
Consistency limitation: the mapped westward motion of the Anatolian block corresponds to left-lateral strike-slip faulting on the East Anatolian strand and right-lateral strike-slip faulting on the North Anatolian strand. East–west maximum compression for the acute-bisector construction instead predicts the opposite pair. The stress orientation compatible with the mapped senses lies near the north–south, obtuse bisector; the planes are then about from , which would give in the optimal-formation formula. A negative friction angle is inadmissible for ordinary frictional strength. Thus is the formal magnitude inferred from unoriented angles, while the full map does not support a self-consistent positive-friction, optimally formed conjugate pair. The common-stress assumption can still describe inherited or anisotropically controlled faults, but then their orientations no longer determine a unique coefficient.
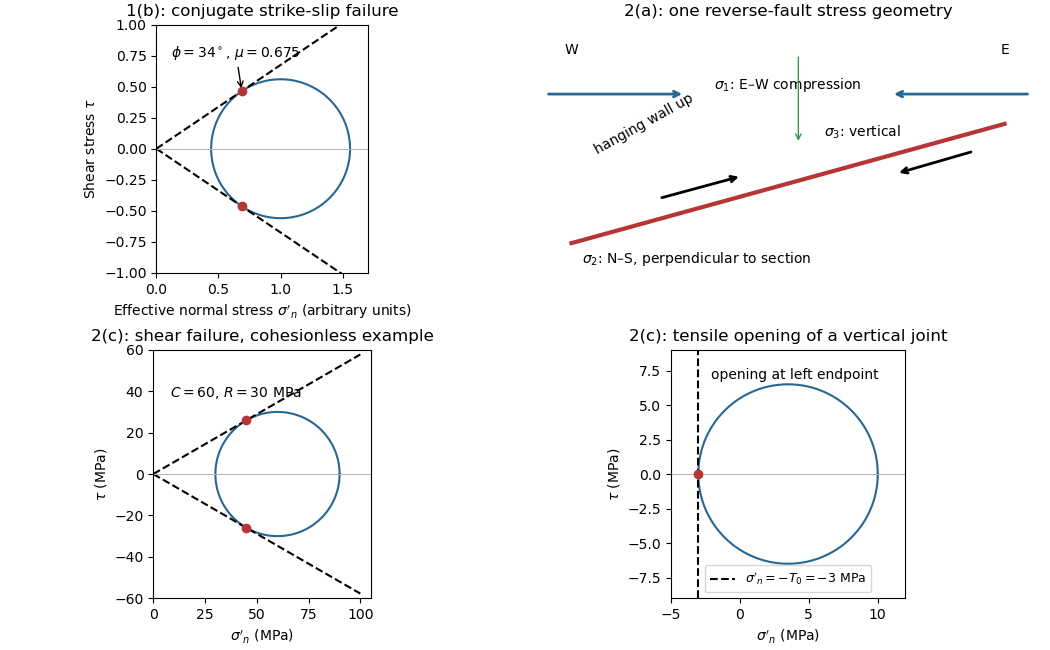
The fault dips are approximately . The mapped senses of fault slip are predominantly strike-slip faulting. In an Andersonian faulting regime, the intermediate principal stress is vertical and the maximum and minimum principal stresses are horizontal, so the preferred fault planes are vertical. Local bends can introduce oblique-slip faulting without changing this first-order interpretation.
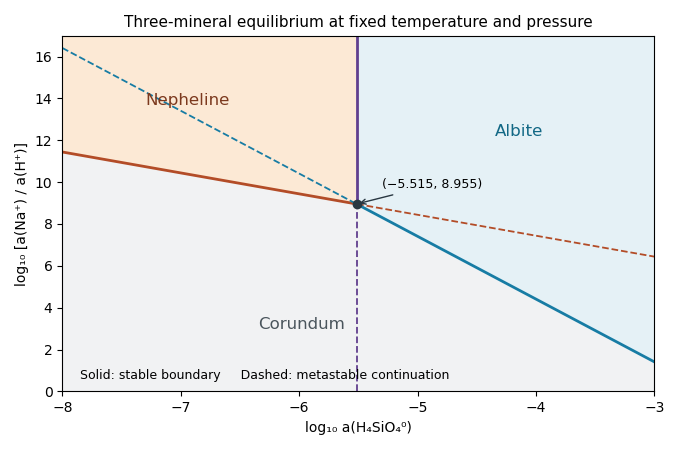
The stable fields areThus corundum occupies the low- field, nepheline the upper-left field and albite the upper-right field. Pairwise coexistence applies on the indicated stable boundaries, and all three coexist at . These are stability statements within the three-mineral chemical system, not a claim that other possible minerals have been excluded in nature.
Let and . The common-potential test for a three-mineral activity diagram gives relative potentials, in one positive energy unit,The stable phase minimizes these potentials. Consequently the stable nepheline–corundum branch has , the stable albite–corundum branch has , and the stable nepheline–albite branch has , . Draw them solid.
The other halves of each line are metastable: a third mineral has lower potential there. In particular, below the triple point the vertical equality describes two phases both less stable than corundum. Extend those halves as dashed lines. This thermodynamic comparison prevents the incorrect use of all three complete pairwise lines as stable field boundaries.
For the reaction direction in part ii, pure solids and unit water activity give . ThereforePlot a vertical line through the common intersection, independent of . Increasing dissolved silica favors albite, consistently with its larger Si/Al ratio. The vertical line’s stable and metastable portions are selected by comparison with corundum, not by its own mass-action equation alone.
Subtract reaction (b) from reaction (a) and divide by two. In the direction chosen here, the resulting balanced conversion isThus nepheline plus dissolved silica converts to albite. Additivity of the Gibbs energy of reaction, equivalently Hess's law, givesFor the reverse reaction the answer is ; the reaction direction must accompany the equilibrium constant.
Set and , treating the supplied concentration notation as an ideal-dilute activity approximation. For pure solids and unit water activity, the first chemical equilibrium relation gives and the second gives . Thus plotTheir slopes are and respectively. They intersect at . Both the relevant silica activities and the intersection lie at negative , as expected for a dilute aqueous silica species.


With water fugacity coefficient , use bar. Retain the same ideal mineral-site activities, givingHenceThe lower fluid chemical fugacity stabilizes the water-bearing products of the forward dehydration relative to the ideal-gas calculation and lowers the required temperature by about K. Here the stated fugacity coefficient is treated as a given constant for evaluating the equilibrium.
An activity model is required in addition to the two compositions. Use ideal multisite mineral activity: independent ideal Fe–Mg mixing on the three relevant sites per formula unit givesThe garnet/biotite activity ratio is . All other solids are pure, so the dimensionless reaction quotient isWith the same pressure-corrected numerator as in part b,Diluting the magnesian product endmember more strongly than the reactant favors the forward dehydration and lowers its equilibrium temperature. The powers of three count Fe–Mg mixing sites, not three formula units of either mineral. Nonideal site interactions or site partitioning would change these activities. If ideal mixing of whole formula units rather than sites were intended, activities would instead be and ; composition alone does not select that different model. The calculation explicitly adopts the conventional ideal-site interpretation.
Integrate the solids’ molar volume contribution from bar and use ideal-gas water chemical fugacity . For pure solids,The logarithm is dimensionless, and can be multiplied directly by pressure in bars. Therefore the dehydration equilibrium with ideal-gas fluid givesHence K, or C. Do not also add a constant gas-volume pressure term: the water contribution has already been integrated through . Ideal-gas behavior at kbar is a prescribed model approximation, not a realistic equation of state. The solid volume correction is distinct from it.
There are unlisted articles, also show them or only show them.