Cold molecular hydrogen is difficult to observe directly: its homonuclear symmetry forbids electric-dipole rotational transitions, and its lowest useful quadrupole rotational excitation is high compared with a cold cloud's temperature. Carbon monoxide is relatively abundant, has a permanent dipole moment and has low-lying rotational transitions that can be collisionally excited in cold gas. The low- lines lie in accessible millimetre bands and suffer much less dust extinction than visible light. They therefore reveal molecular-gas velocities and spatial structure efficiently.
The advantages do not turn CO into a direct mass counter without a model. Common-isotope lines can be optically thick; excitation can be subthermal or have multiple temperatures. Abundance changes with metallicity, chemistry, shielding and photodissociation, and CO can freeze onto grains. Molecular hydrogen can also survive where CO is weak, giving CO-dark gas. A calibrated carbon-monoxide tracer of molecular hydrogen conversion may be useful for appropriate cloud populations but should not be transplanted uncritically to newly formed supernova ejecta. The line calculations here infer CO mass, not total molecular mass unless a CO-to-hydrogen abundance is separately known.
Assume a single-temperature optically thin local thermodynamic equilibrium population, negligible line absorption/stimulated corrections, and that the measured line luminosity is from the remnant's CO. Each spontaneous decay emits , givingFor a rigid rotor, with K. The degeneracy is , and the rotational partition function isAt 20 K the direct sum gives , ; the approximation is already adequate. Thus, with molecular mass ,The remnant age does not enter this optically thin population count. It becomes relevant when estimating emitting volume, density, expansion and optical depth to test the assumptions.
For optically thin CO rotational thermometry of the same emitting population, the upper-level abundance ratio isThe difference can be obtained directly from the two successive transition frequencies, , or approximately from . Using the supplied rounded molecular data gives K. ThereforeThe observed ratio is , henceAt 20 K the predicted ratio would be only about 61, so the two detections reject that single-temperature optically thin 20-K model. The inferred value is an excitation temperature under the stated assumptions, not a model-independent measurement of the gas's kinetic temperature.
Raising the temperature populates higher rotational states and reduces the fraction in . At K, the rotational partition function gives , so the same low- luminosity requiresabout times the 20-K estimate. Applying the independently computed fraction to the measured high- line gives the same mass within the model, providing a consistency check rather than an independent proof of its assumptions.
Optical depth, density-dependent excitation, multiple temperature components, beam dilution, aperture mismatch, line blending and flux calibration all need investigation. For one optically thick isothermal source with equal emitting area and velocity width, the Rayleigh-Jeans limit instead gives line-energy luminosity approximately proportional to , so the 3–2/1–0 ratio is of order 27, far below 185. That illustrates why optical-depth and emitting-area assumptions cannot be ignored; different source areas or excitation structures can change this simple comparison. Optically thick clumps can hide mass, and a high-temperature component may dominate the 3–2 line while colder material contributes much of the 1–0 emission.
Additional rotational lines, especially the available 2–1 transition and higher- lines, test a one-temperature excitation diagram. Less abundant isotopologues help constrain opacity; resolved imaging and line profiles constrain emitting volume and homologous expansion, using the remnant age. Density information permits non-LTE statistical-equilibrium/radiative-transfer modelling. Dust emission can provide a complementary mass constraint with its own opacity and dust-to-gas uncertainties. A total gas mass additionally needs a justified CO abundance, accounting for molecular formation, destruction and unobserved material.
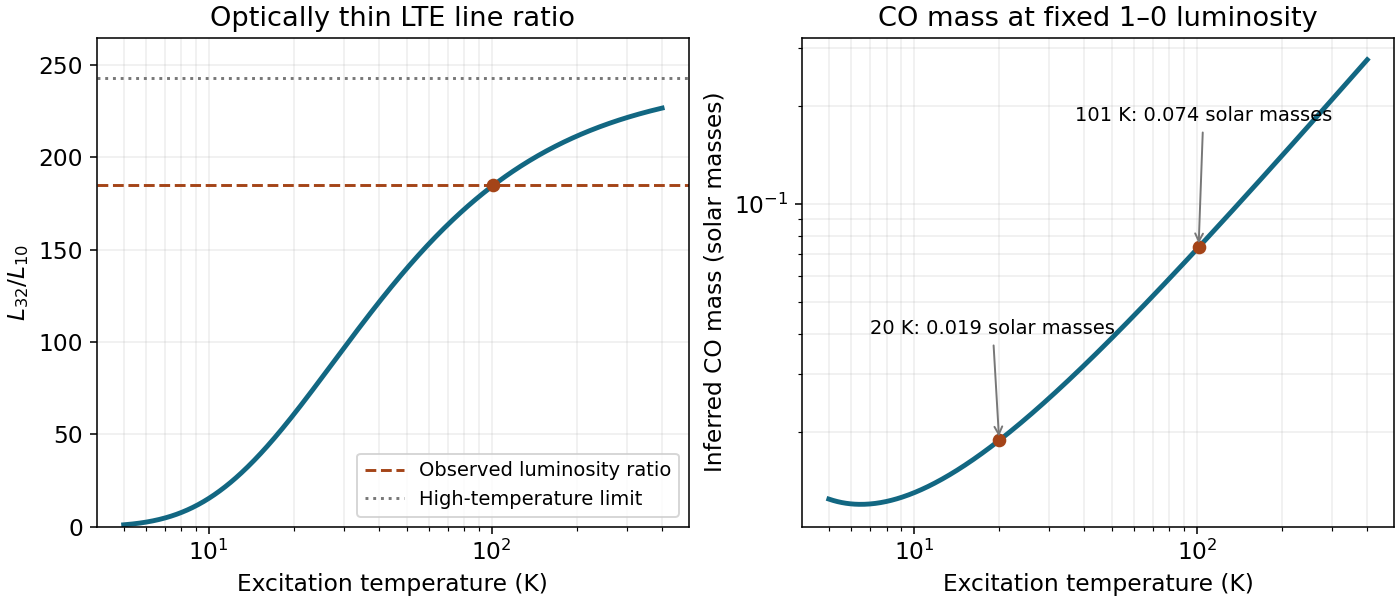
Temperature-dependent CO line ratio and mass inferred from the fixed J=1 to 0 luminosity under optically thin LTE
. Details. 
Articles by others on the same topic
There are currently no matching articles.