Pressure calibration assigns pressure values to a sensor's output by comparison with a reference under specified conditions. It is not the same as making the output more finely resolved. A smooth electrical resistance curve can be repeatable yet have an incorrect pressure scale.
Bridgman used pressure-dependent electrical resistance of manganin and established fixed points, including a bismuth transition. He reported poorer accuracy above the better calibrated range.[ref]
General Survey of Certain Results in the Field of High-Pressure Physics by Percy Williams Bridgman. p. 56, pressure-measurement paragraph: manganin gauge, bismuth fixed point, and different accuracy estimates below and above 30000 kg/cm²
A fixed-point specimen and a property-measurement sample have distinct roles: one helps assign the scale, while the other is studied on that scale. The reference transition must itself have an assigned pressure at the relevant temperature. Agreement at a single point does not determine a nonlinear sensor response elsewhere. Comparing increasing and decreasing pressure checks hysteresis; returning to a reference checks drift. These are checks one can design from the measurement model, not additional historical controls asserted for the lecture's experiments.
A resistance pressure gauge is a pressure sensor whose electrical resistance is calibrated against pressure. Even a simple local response needs both pressure and temperature. For an original illustrative model definewhere is the reference electrical resistance at , , and zero history offset. The derivatives and are local sensitivities with units and , respectively; is a dimensionless history offset. Constant sensitivities are an approximation over a chosen range, not material constants valid at every pressure.
Choose synthetic coefficients and , with and . A measured ratio then gives . Ignoring the temperature change gives , a error. This model is deliberately stipulated; these numbers are not measured manganin coefficients or Bridgman's data.
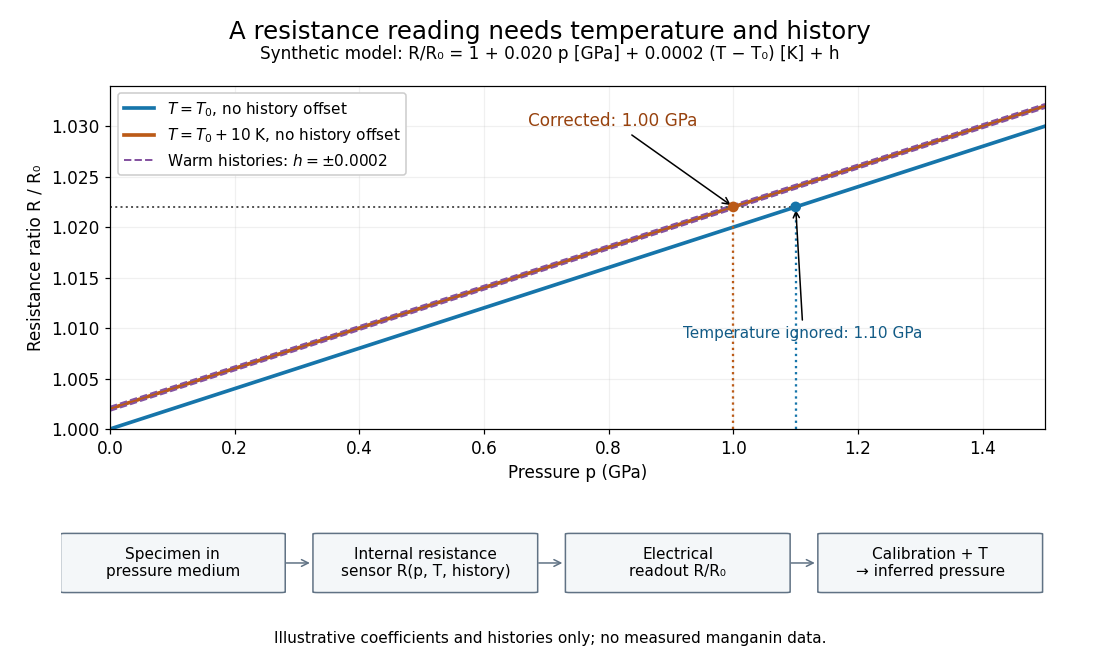
Pressure calibration: a synthetic electrical resistance response with temperature and hysteresis offsets
. Original calculated example. The blue reference line has , ; the orange line has , . Dashed lines illustrate two histories with , not observed data. A ratio 1.022 maps to 1.00 GPa after correcting temperature, or 1.10 GPa if read against the blue line. The lower chain distinguishes the specimen, the internal sensor, the electrical readout and the calibrated pressure. Details.
If two histories differ by , their outputs at the same pressure differ by ; interpreting both with a single history-free curve gives an apparent pressure separation . The half separation is . Reversing the drive can additionally cause mechanical friction hysteresis, independently of this sensor model. Record both the electrical calibration history and the loading direction.
For independent small standard measurement uncertainties and exact stipulated , first-order propagation givesFor , , and , this is . Real calibration also includes coefficient measurement uncertainties, correlations, reference-point measurement uncertainty, and any unresolved nonhydrostatic loading. A sensor calibrates its local environment; it cannot by itself certify the absence of deviatoric stress throughout the sample.
Articles by others on the same topic
There are currently no matching articles.