Topics (318k) Articles (329k) Users (390) Discussions (237) Comments (383) Files (10k) New article
Past exam of the mathematics course of the University of Cambridge 2004 iii Paper 37 4 Solution by  Codex 0 Created 2026-10-03 Updated 2026-10-14
The commands read the 52 cell values into a vector and build the matching two-factor layout. In
expand.grid(country, goods) the first factor varies fastest, so the four countries are listed successively within each goods category. This matches row-by-row reading of the displayed table. Converting Goods to a factor is essential: its labels identify 13 categories and are not a quantitative trend. Country supplies the other categorical factor. The summaries suppress coefficient correlations, not coefficient standard errors.The first fit is the additive two-factor normal linear modelThere are free coefficients and residual statistical degrees of freedom. This is two-way analysis of variance without an interaction term. For this complete balanced layout, ordinary least squares givesThese formulas follow from the row- and column-sum normal equations: fitted row and column totals equal their observed totals. The balanced-design coefficient standard errors are for a goods contrast, for a country contrast, and for the reference-cell intercept. These yield the common contrast standard errors and the different intercept standard error in each summary. In particular the intercept is the fitted Software–UK value, not the grand mean or the observed Software–UK entry.
Thus the first intercept predicts million euros for Software in the UK. The Books coefficient adds million euros to the fitted value in any country, relative to Software; every other goods coefficient has this same arithmetic-difference interpretation. The country coefficients subtract , and million euros from the UK prediction for France, Germany and the rest of Europe respectively, regardless of goods. The model therefore assumes common absolute country differences across goods categories. For Software–France its prediction iswhich is impossible for positive spending and indicates a limitation of this additive original-scale specification.
The residual standard error is million euros, obtained from ; direct calculation gives . Each coefficient's printed statistic is , with a reference distribution under this normal linear model. The two-sided p-values compare each goods category with Software, or each other country with the UK, after adjustment for the other factor. For example France and the rest of Europe differ significantly from the UK at 5%, but Germany does not. The raw-scale significant goods differences are Books, Clothing, Electronic Goods, Groceries and Leisure Travel; these are individual reference-level comparisons, not an overall test of the goods factor.
The coefficient of determination is . The omnibus F-test compares all 15 nonintercept coefficients with zero:with reference and . This says at least one factor contrast is nonzero under the assumed error model. There is one observation per cell, so an unrestricted goods-country interaction would saturate the model, leaving zero residual degrees of freedom. Without replication or a specified interaction structure, the residual variation cannot be separated into interaction and independent error.
The second fit applies a logarithmic transformation and fits the same factor design to . The Gaussian log-response model isIts intercept exponentiates to a fitted Software–UK conditional median of million euros. Goods coefficients now give multiplicative ratios to Software, and country coefficients give multiplicative ratios to the UK. The estimated country ratios areFor example the Books ratio is and the Sports Equipment ratio is , consistently across countries. The model assumes common relative, rather than common absolute, country effects. It also guarantees positive retransformed fitted values. Under normal log errors, the original-scale conditional mean is , whereas is the conditional median and geometric mean. Correcting the retransformation bias here multiplies the naive predictions by approximately .
The log-scale residual standard error is , with the same 36 residual degrees of freedom, corresponding to a typical multiplicative error multiplier . France and the rest remain significant reference-country contrasts; Germany remains nonsignificant at 5%. The log-scale significant reference-goods contrasts are Books, Music, Videos/DVDs, Clothing, Sports Equipment, Electronic Goods, Groceries and Leisure Travel. Event Tickets, Toys, Video Games and Housewares do not individually differ significantly from Software at that level. These p-values remain subject to the usual multiple testing qualification.
The log-scale is computed using variation in the logarithms, so it cannot by itself establish better fit on the original response scale. The change is plausible because spending varies widely in magnitude and relative discrepancies are more meaningful than constant absolute discrepancies, but it should be assessed with regression diagnostics, especially a residual-versus-fitted plot and a normal Q-Q plot. The minimum residual near merits inspection; the command summaries alone do not verify independent normal errors. Moreover these responses are forecasts, so the inferential p-values have a literal sampling interpretation only if an appropriate stochastic model for their uncertainty is justified.
The log-scale analysis of variance adds Goods and then Country. In this balanced design their effect spaces are orthogonal after removing the intercept, so the sequential sums of squares equal the corresponding adjusted factor sums and are unchanged by reversing the two factors:The residual sum of squares is , giving . ThusTheir tiny upper-tail p-values show strong overall goods and country effects under the log-error model; a globally significant country factor is compatible with the nonsignificant individual Germany contrast. The omnibus fit statistic is on degrees of freedom, whose p-value is approximately . The printed zero reflects numerical formatting, not an exactly zero probability.
If two cell entries were missing, retain their correct factor labels and mark those responses unavailable, rather than shifting the remaining scan values into different cells. Fit the additive models to the 50 observed cells, assuming the missingness mechanism permits those observations to be analyzed without selection bias. All factor levels remain represented, and the row-column incidence graph remains connected: any two goods rows still share an observed country, since only two edges of the complete layout have been removed, and every country still has many observed goods. By identifiability of an incomplete two-factor additive design, the design therefore still has rank . HenceThe coefficients and their covariance must be recomputed by the observed-cell ordinary least squares equations. The balanced row-mean-plus-column-mean formulas and common within-factor standard errors no longer apply. Goods and Country effects are generally no longer orthogonal, so sequential ANOVA sums can depend on order; factor tests adjusted for the other factor should use nested model comparisons. Missing cells do not restore replication or make an unrestricted interaction test possible: that larger model still fits every observed cell exactly. If missingness depends on the unavailable spending values, additional modelling of that mechanism would be needed.
Past exam of the mathematics course of the University of Cambridge 2004 iii Paper 37 3 Solution by Codex 0 Created 2026-10-03 Updated 2026-10-14
Codex 0 Created 2026-10-03 Updated 2026-10-14The first output uses the equal-variance, pooled Student's t-test, as shown by its seven statistical degrees of freedom. Its exact model assumes two independent samples from normal distributions, with means and a common unknown variance . The hypotheses are against . The sample means are and , and the unbiased within-sample sample variances areThe pooled sample variance and its resulting standard error areHenceTo justify its reference distribution, under the null is standard normal, while is , independently of the two sample means. Dividing the first variable by the square root of the second divided by seven gives the exact pooled two-sample t statistic, with Student t-distribution . Its one-sided p-value is the lower tailThe associated one-sided 95% confidence interval for isThe printed missing lower bound means that this is a one-sided upper confidence limit, not that a finite lower endpoint should be estimated. With such small samples the normality and common-variance assumptions matter; a Welch analysis would use a different variance estimate and generally different degrees of freedom.
The second output is the Wilcoxon rank sum test for two independent continuous samples. Under a common-distribution null hypothesis, labels are exchangeable conditional on the pooled values, so the four ranks assigned to the first sample form a uniformly chosen four-element subset of . The first sample receives ranks , giving raw rank sumEquivalently the Mann–Whitney U test statistic is , the number of cross-sample pairs with an observation larger than a observation. This output reports the raw rank sum, rather than the shifted statistic used by some software.
A first sample tending to be smaller has a small rank sum. Under the null, all rank allocations have equal probability. Only and have rank sum at most 11. By the exact rank-sum tail one above the minimum, the exact lower-tail p-value isNo large-sample normal approximation or continuity correction is involved; the absence of ties makes this simple enumeration valid. For a common-shape location-shift family, the test's alternative is a negative location shift of relative to . Without that model, the null is equality of distributions and the rank comparison is not simply a test of equality of means or medians.
Both tests reject at the 5% level in the direction of smaller observations; only the pooled t-test rejects at 1%. The t-test uses the numerical spacing and targets a mean difference under its normal model. The rank-sum test uses ordering and an exact exchangeability calculation, avoiding the normality and common-normal-variance assumptions. Their different p-values therefore reflect both different statistics and different modelling assumptions, not a numerical contradiction.
Pinned article: Introduction to the OurBigBook Project
Welcome to the OurBigBook Project! Our goal is to create the perfect publishing platform for STEM subjects, and get university-level students to write the best free STEM tutorials ever.
Everyone is welcome to create an account and play with the site: ourbigbook.com/go/register. We belive that students themselves can write amazing tutorials, but teachers are welcome too. You can write about anything you want, it doesn't have to be STEM or even educational. Silly test content is very welcome and you won't be penalized in any way. Just keep it legal!
Intro to OurBigBook
. Source. We have two killer features:
- topics: topics group articles by different users with the same title, e.g. here is the topic for the "Fundamental Theorem of Calculus" ourbigbook.com/go/topic/fundamental-theorem-of-calculusArticles of different users are sorted by upvote within each article page. This feature is a bit like:
- a Wikipedia where each user can have their own version of each article
- a Q&A website like Stack Overflow, where multiple people can give their views on a given topic, and the best ones are sorted by upvote. Except you don't need to wait for someone to ask first, and any topic goes, no matter how narrow or broad
This feature makes it possible for readers to find better explanations of any topic created by other writers. And it allows writers to create an explanation in a place that readers might actually find it.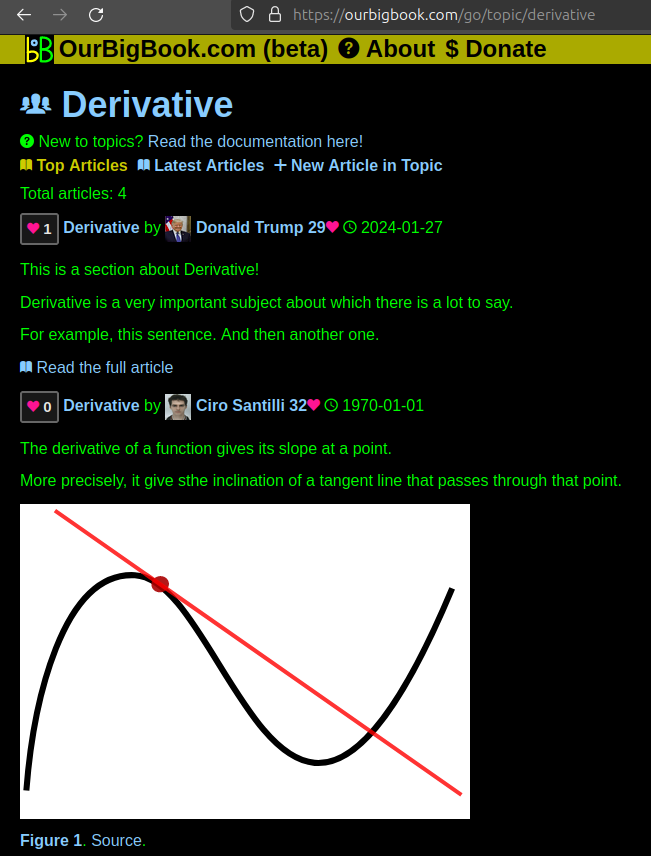
Figure 1. Screenshot of the "Derivative" topic page. View it live at: ourbigbook.com/go/topic/derivativeVideo 2. OurBigBook Web topics demo. Source. - local editing: you can store all your personal knowledge base content locally in a plaintext markup format that can be edited locally and published either:This way you can be sure that even if OurBigBook.com were to go down one day (which we have no plans to do as it is quite cheap to host!), your content will still be perfectly readable as a static site.
- to OurBigBook.com to get awesome multi-user features like topics and likes
- as HTML files to a static website, which you can host yourself for free on many external providers like GitHub Pages, and remain in full control

Figure 2. You can publish local OurBigBook lightweight markup files to either OurBigBook.com or as a static website.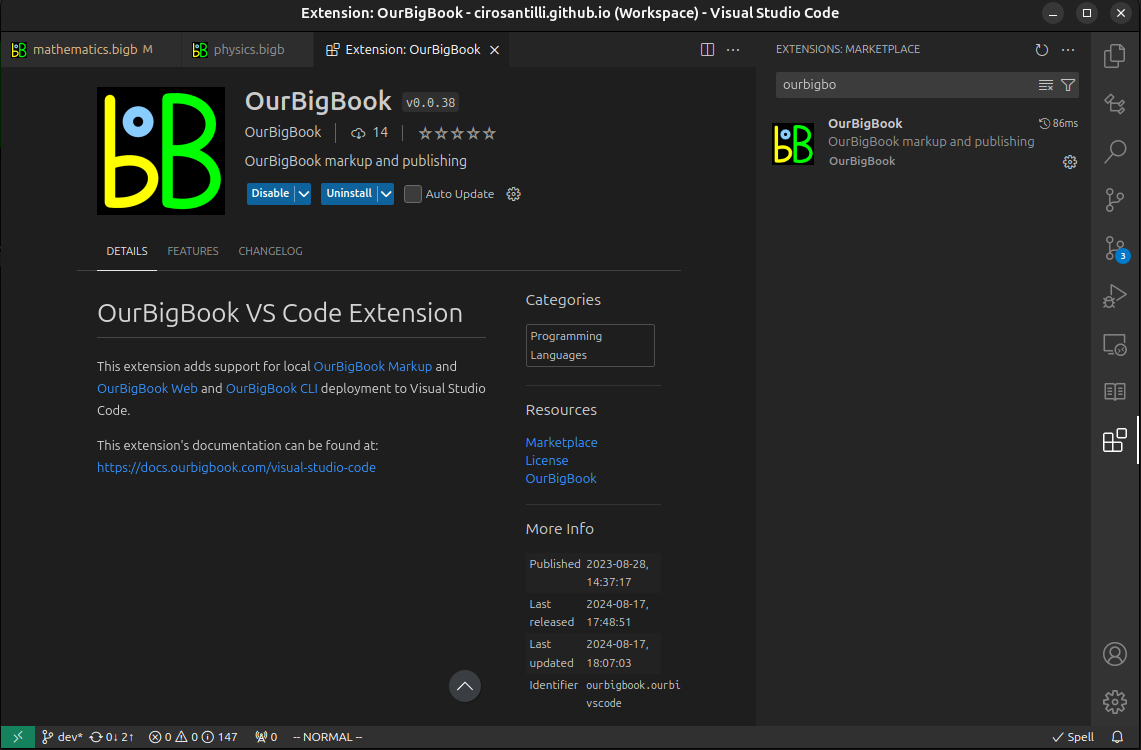
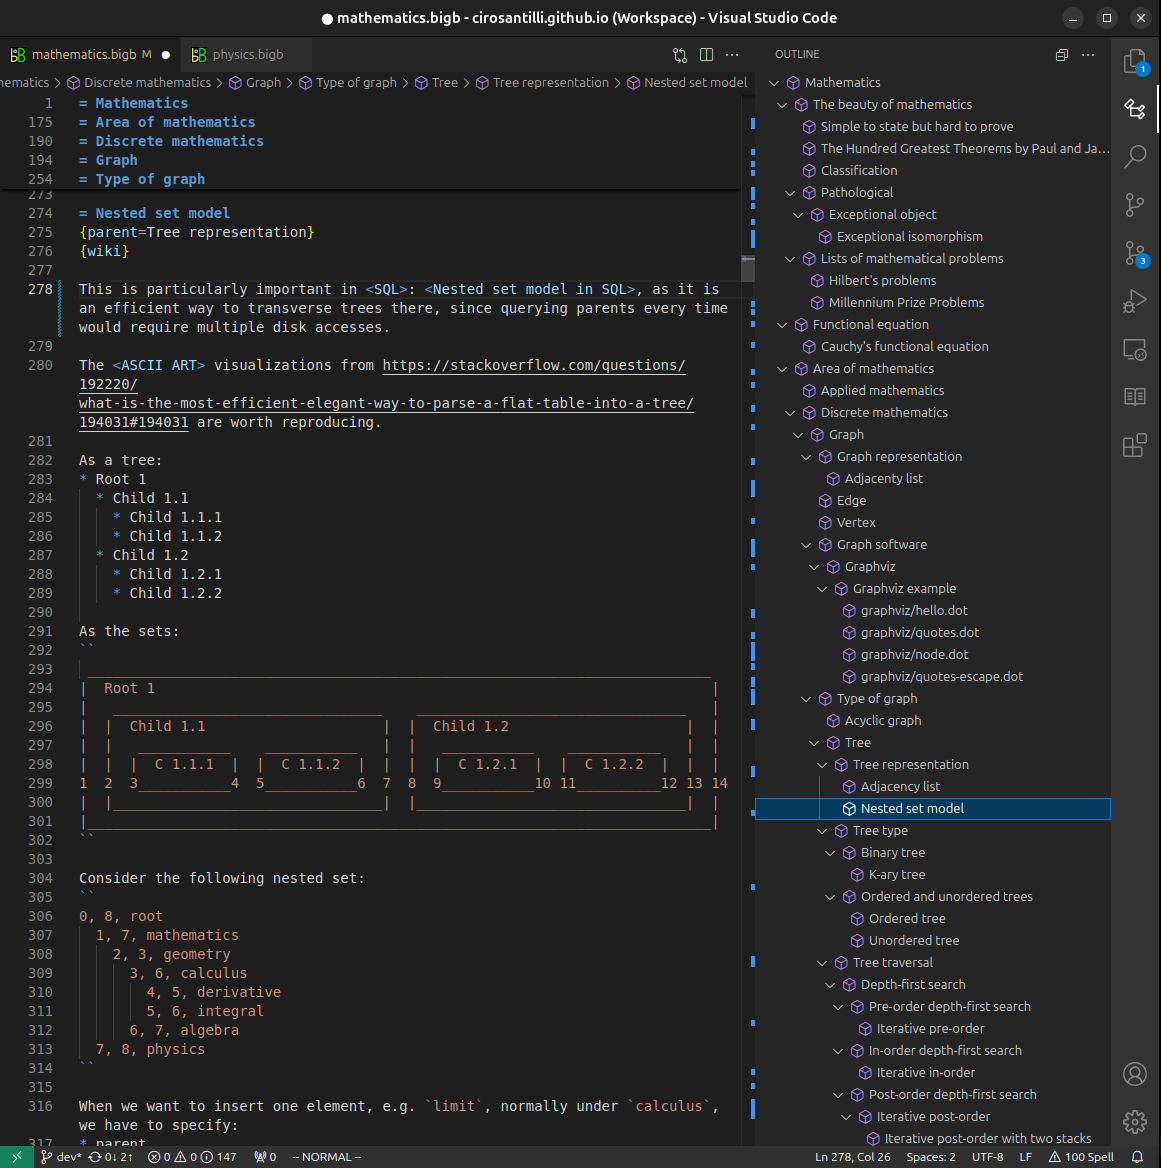
Figure 3. Visual Studio Code extension installation.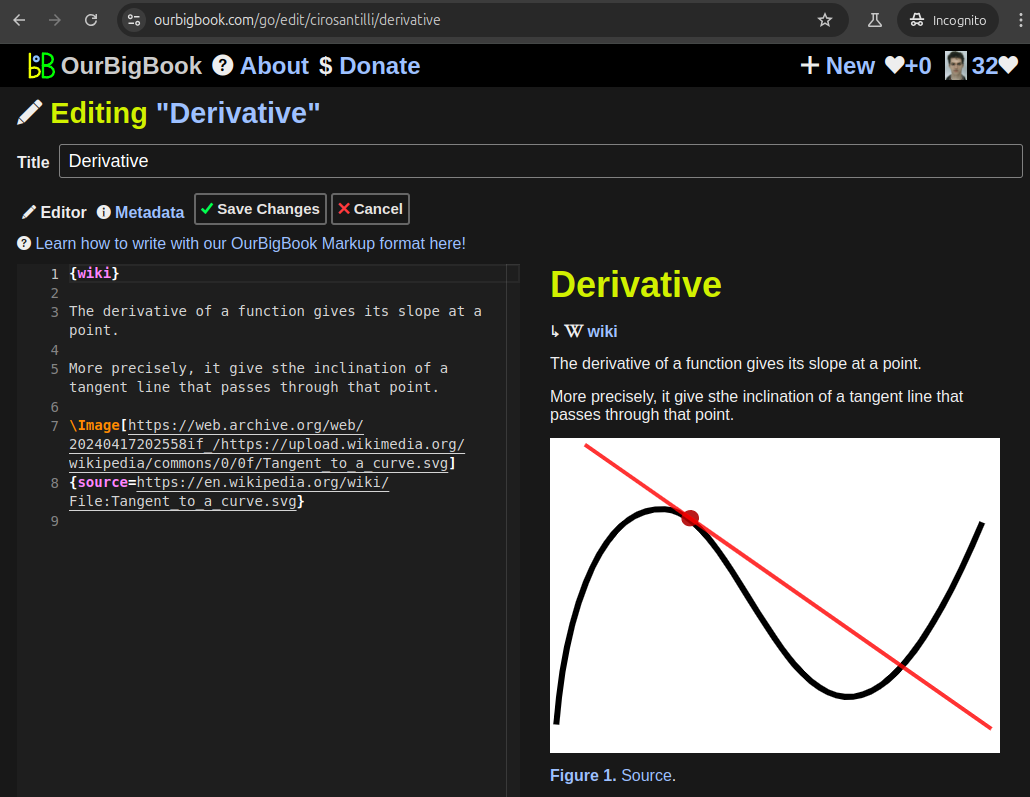
Figure 5. . You can also edit articles on the Web editor without installing anything locally. Video 3. Edit locally and publish demo. Source. This shows editing OurBigBook Markup and publishing it using the Visual Studio Code extension. 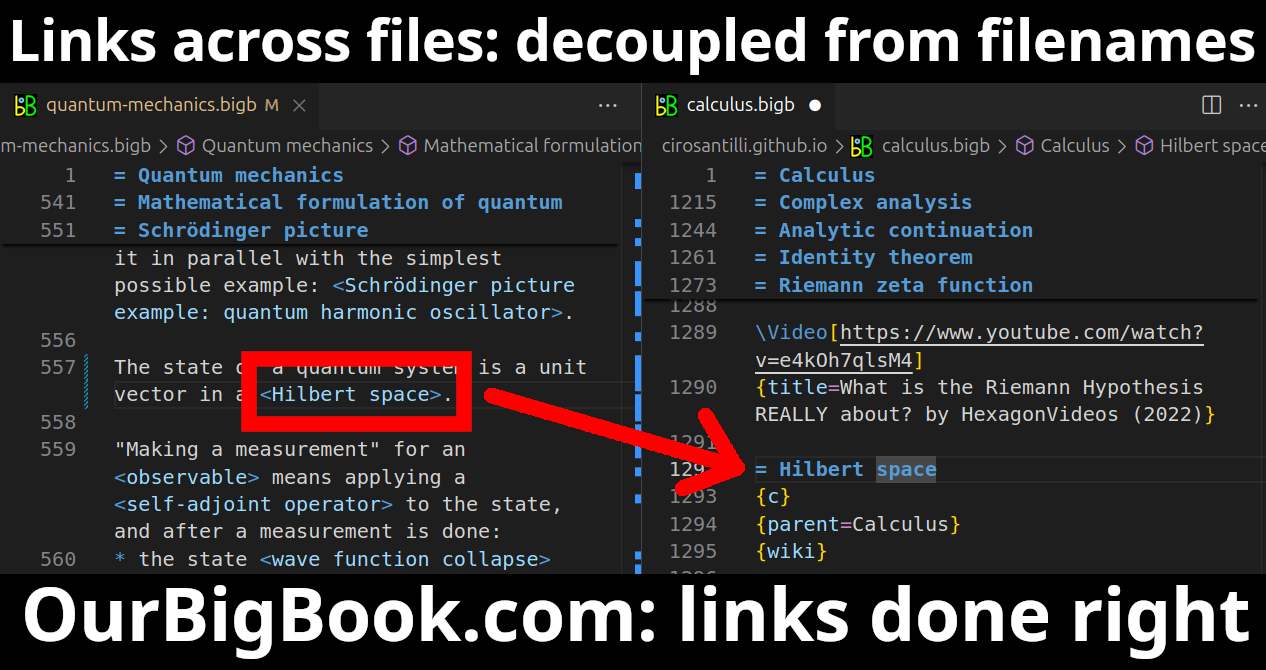
- Infinitely deep tables of contents:

All our software is open source and hosted at: github.com/ourbigbook/ourbigbook
Further documentation can be found at: docs.ourbigbook.com
Feel free to reach our to us for any help or suggestions: docs.ourbigbook.com/#contact