For an isolated fluorescent molecule at displacement from the scanning optical focus, write for relative excitation light intensity and for the fraction of its collected emission passed by a centred detection pinhole of radius . The expected response, apart from a common brightness and collection factor, isHere is position in the detection-pinhole plane and is the emitted light intensity distribution there conditional on collection, with units of inverse area. This point spread function normalization retains throughput: is a fraction, not a curve rescaled to have peak one. The product expresses excitation followed by detection; it is an intensity/probability product, not multiplication of coherent wave amplitudes from different molecules. [ref]
Confocal microscopy (chapter manuscript) by Brad Amos and others. Manuscript p. 16, Fig. 4 discussion; Appendix §5, p. 37, Eq. A17: illumination-times-detection response
Assume linear, unsaturated fluorescence, independent emitters whose light intensities add, a stationary specimen, fixed collection efficiency and quantum efficiency, and negligible changes from scattering, absorption or bleaching during a scan. Different excitation and emission wavelengths generally give different excitation and detection responses. For a sufficiently small pinhole, is approximately its area times at the centre; this is the familiar excitation-times-detection point spread function. It is not universally the square of one point spread function. A spatially invariant response further allows the image to be expressed as a convolution with the emitter distribution; depth-dependent optical aberrations can invalidate that approximation.
For an explicitly synthetic axial example, put and choose an on-axis excitation , inspired by a Gaussian beam. Stipulate a circular Gaussian function for the detection-plane light intensity, with standard deviation . In dimensionless coordinates , put . ThenThe expression for follows by integrating over a disk using polar coordinates. The assumptions specify a toy model with matched axial scales; its parameters are not a calibration for a real objective optical lens. It omits Airy disk rings, vector diffraction, and unequal excitation and emission wavelengths.
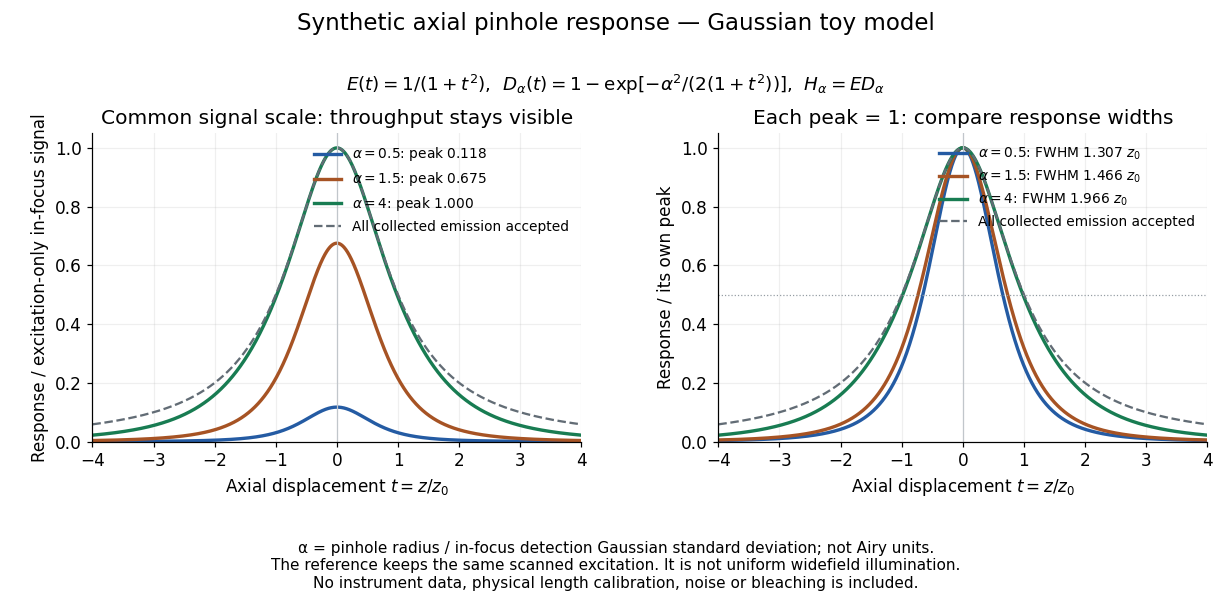
Synthetic axial response: narrower pinholes reduce throughput and suppress defocus
. Original Gaussian toy model, not measurements. The left panel keeps a common signal scale; the right divides each response by its own peak to compare widths. Here is a radius in units of detection-plane Gaussian standard deviation, not an Airy-unit diameter. The dashed reference is the same scanned excitation with all collected emission accepted, not conventional uniform widefield illumination. Both panels retain nonzero out-of-focus tails. Details.
For a vanishingly small pinhole, the peak-normalized synthetic response tends to , whose full width at half maximum is . With all collected emission accepted it tends to , of width . Meanwhile as the pinhole closes. The narrower normalized curve therefore accompanies a vanishing detected signal; peak normalization must not conceal that loss.
Articles by others on the same topic
There are currently no matching articles.