A fluorescence microscope maps photon emission to an image. Excitation light passes through a fluorescence excitation filter and reflects from a wavelength-selective beam splitter into the objective optical lens. Returning fluorescence passes through that beam splitter and a fluorescence emission filter to the photodetector. Rejecting excitation makes faint emission visible.[ref]
Advanced Fluorescence Microscopy Techniques—FRAP, FLIP, FLAP, FRET and FLIM by Hellen C. Ishikawa-Ankerhold and others. §1.2.1, Figure 5 and excitation/emission-filter paragraphs
An ordinary image records emission-band counts at each pixel. Adding pulse-delay measurements gives a fluorescence lifetime map; scanning emission wavelength gives spectral information instead. Confocal microscopy adds spatial rejection and confocal optical sectioning, as developed in its own branch. An unlabeled specimen under the same illumination reveals intrinsic fluorescence and excitation leakage; excitation-blocked frames reveal detector background. A blank cannot perfectly predict background in a differently prepared specimen.
Fluorescence measurements resolving individual labelled molecules or molecular events, allowing heterogeneous dynamics to be distinguished from population averages.
Uncertainty in an estimated emitter position. It can be much smaller than the width of its point spread function, but it does not by itself guarantee that densely packed emitters or an entire labelled structure are resolved.
fluorescence microscopy forms images from spatially resolved fluorescence. Probe partitioning, optical resolution and photophysics constrain what a fluorescent pattern establishes about molecular composition or contact.
Live-cell imaging follows living biological cells over time. Labels, illumination and immobilization must be checked for effects on the process being measured; an apparently sharp image is not sufficient evidence that the cell remains physiologically unperturbed.
Imaging of biological events in a living organism. Repeated cell tracking can establish event ordering but requires controls for phototoxicity, imaging access and sampling.
An illumination-induced change in a fluorescent label that allows a selected cell or region to be distinguished and followed over time.
Biological damage caused by illumination, which can alter development even when an image remains visually clear. Non-imaged and dose-matched controls help identify it.
A fluorescence microscope technique that illuminates a thin plane and detects emitted light from another direction, enabling repeated optical sectioning of living specimens.
A fluorescence excitation filter selects the illumination wavelength band reaching the specimen. Its finite transmission changes the absorbed photon rate and thus image brightness. Specify that band when interpreting a fluorescence excitation spectrum or comparing images.
A fluorescence emission filter transmits the chosen emitted wavelength band while rejecting excitation leakage. Finite rejection, overlap of the fluorescence emission spectrum with excitation, and the photodetector's wavelength-dependent response can all affect the count. A darker filtered image alone does not establish a changed fluorescence lifetime or increased photobleaching.
Confocal microscopy forms an image by scanning a localized illumination spot and preferentially detecting light from the same small region. In a thick specimen emitting fluorescence, a conventional fluorescence microscope also collects a haze from material away from the selected optical focus. Confocal optical sectioning suppresses that haze, revealing structure at a chosen depth without cutting the specimen. The useful idea is a paired selection: where excitation occurs, and which emitted photons reach the photodetector. [ref]
Introductory Confocal Concepts by Nikon Instruments Inc.. Introductory Confocal Concepts, opening paragraphs and Fig. 2: out-of-focus fluorescence and optical sections
The scope here is single-point, linear fluorescence imaging. Confocal microscopy can also use reflected light; its broader implementations need not all have the same scanning mechanism. The patent Microscopy apparatus, US3013467A, by Marvin Minsky describes a point source imaged onto a specimen, a second pinhole receiving its image, specimen scanning, and a synchronized display. It was filed on 7 November 1957 and published on 19 December 1961; the filing date should not be described as the grant date. This is evidence for that apparatus and those dates, rather than a claim that all later fluorescence instruments were already present in it. [ref]
Microscopy apparatus by Marvin Minsky. Front-page filing/publication metadata; description, Optical System, Fig. 1; Stage Scanning System
Two planes are optically conjugate when an optical lens system images one onto the other. In confocal microscopy, an illumination pinhole is imaged onto the selected specimen point, and that specimen point is imaged onto the detection pinhole. Thus the two apertures select corresponding positions in different planes; they need not occupy the same physical plane. Modern laser instruments can supply the illumination point with an optical fiber or a suitable focused laser mode instead of a separate metal illumination pinhole. [ref]
Confocal microscopy (chapter manuscript) by Brad Amos and others. Amos, McConnell and Wilson, Confocal microscopy, manuscript pp. 5, 7–8: conjugate foci, Fig. 3, fiber-delivered illumination
A fluorescent emitter at the selected optical focus forms a compact point spread function at the detection aperture. An emitter displaced axially produces a broadened spot there through defocus; a smaller fraction of its collected light passes. The emitter still exists and still emits photons. Rejected photons strike the opaque mask or other parts of the instrument instead of contributing to the accepted detector channel. Neither a finite pinhole nor diffraction makes the accepted out-of-focus contribution exactly zero.
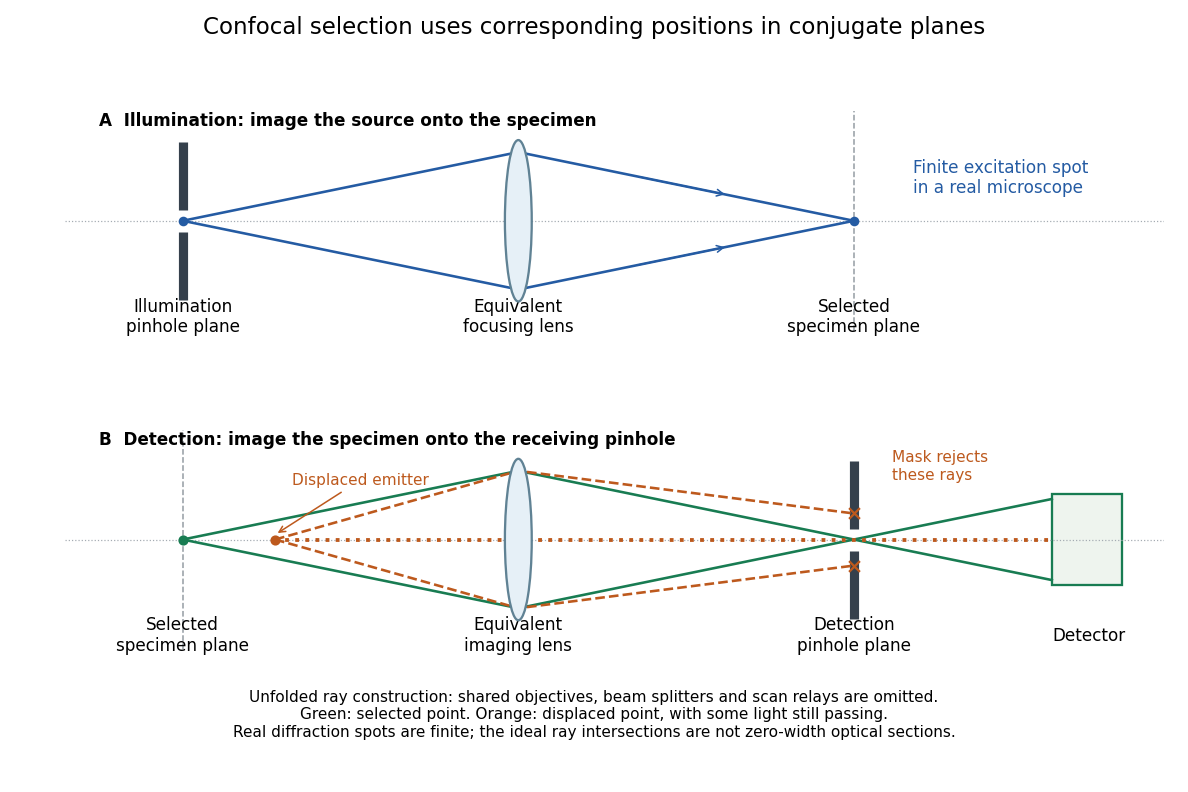
Conjugate illumination and detection pinholes in confocal microscopy
. Original unfolded geometrical optics schematic, not a scale drawing of an instrument. The top panel images an illumination pinhole onto the specimen; the lower panel images the selected specimen point onto the detection pinhole. Dashed orange light rays from an axially displaced point strike the mask, while an axial orange light ray passes. Real spots have finite point spread functions through diffraction; the drawing's perfect green intersection is only a ray construction. A fluorescence instrument may fold both paths through the same objective optical lens using a wavelength-selective beam splitter. Details.At one depth, scan the illumination spot across and and assign the detector reading during each dwell interval to a pixel. Move the specimen or objective optical lens axially to acquire the next depth. A stack of these optical sections samples three-dimensional structure. With beam scanning, the returning fluorescence commonly retraces the scanning optics: this descanning holds the image of the currently illuminated point at the detection pinhole. With stage scanning, the fixed spot and pinhole remain aligned while the specimen moves. [ref]
An optical section is a depth-weighted image of an intact specimen, with a finite axial response and tails. A physical cut actually separates a slice of material; its thickness and cutting damage are properties of the preparation. Changing optical focus selects another optical section without removing a slice, although illumination can still damage a specimen. Neither a thin physical slice nor a sharply displayed optical section makes the imaging point spread function infinitely narrow. [ref]
Introductory Confocal Concepts by Nikon Instruments Inc.. Fig. 2 discussion: focused-light sections rather than physical sectioning
Point response and section thickness answer different questions. For a spatially uniform, very thin fluorescent sheet, its response versus axial displacement is proportional to the lateral integral of the three-dimensional confocal response,Consequently a trace through a single bead, , does not by itself give the sheet's optical-section thickness. State which object and which full width at half maximum are being measured. A smaller axial sampling step gives more samples of the same response, rather than automatically improving diffraction-limited resolution. [ref]
Confocal microscopy (chapter manuscript) by Brad Amos and others. Appendix §6, manuscript pp. 42–43: thin fluorescent sheet translated through focus
For an isolated fluorescent molecule at displacement from the scanning optical focus, write for relative excitation light intensity and for the fraction of its collected emission passed by a centred detection pinhole of radius . The expected response, apart from a common brightness and collection factor, isHere is position in the detection-pinhole plane and is the emitted light intensity distribution there conditional on collection, with units of inverse area. This point spread function normalization retains throughput: is a fraction, not a curve rescaled to have peak one. The product expresses excitation followed by detection; it is an intensity/probability product, not multiplication of coherent wave amplitudes from different molecules. [ref]
Confocal microscopy (chapter manuscript) by Brad Amos and others. Manuscript p. 16, Fig. 4 discussion; Appendix §5, p. 37, Eq. A17: illumination-times-detection response
Assume linear, unsaturated fluorescence, independent emitters whose light intensities add, a stationary specimen, fixed collection efficiency and quantum efficiency, and negligible changes from scattering, absorption or bleaching during a scan. Different excitation and emission wavelengths generally give different excitation and detection responses. For a sufficiently small pinhole, is approximately its area times at the centre; this is the familiar excitation-times-detection point spread function. It is not universally the square of one point spread function. A spatially invariant response further allows the image to be expressed as a convolution with the emitter distribution; depth-dependent optical aberrations can invalidate that approximation.
For an explicitly synthetic axial example, put and choose an on-axis excitation , inspired by a Gaussian beam. Stipulate a circular Gaussian function for the detection-plane light intensity, with standard deviation . In dimensionless coordinates , put . ThenThe expression for follows by integrating over a disk using polar coordinates. The assumptions specify a toy model with matched axial scales; its parameters are not a calibration for a real objective optical lens. It omits Airy disk rings, vector diffraction, and unequal excitation and emission wavelengths.
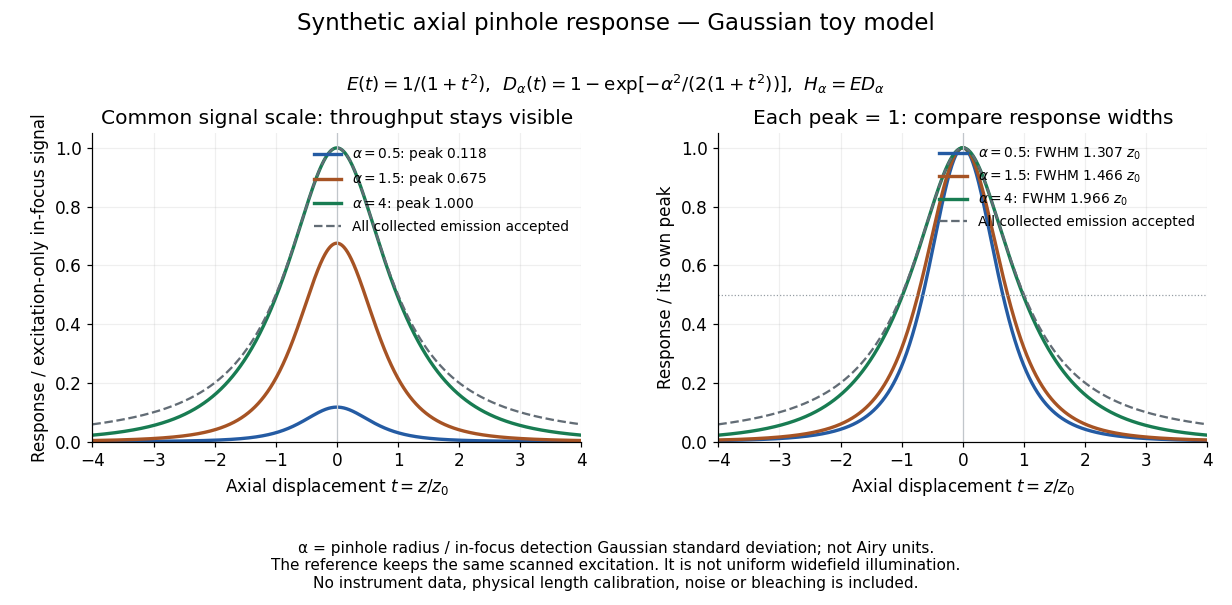
Synthetic axial response: narrower pinholes reduce throughput and suppress defocus
. Original Gaussian toy model, not measurements. The left panel keeps a common signal scale; the right divides each response by its own peak to compare widths. Here is a radius in units of detection-plane Gaussian standard deviation, not an Airy-unit diameter. The dashed reference is the same scanned excitation with all collected emission accepted, not conventional uniform widefield illumination. Both panels retain nonzero out-of-focus tails. Details.For a vanishingly small pinhole, the peak-normalized synthetic response tends to , whose full width at half maximum is . With all collected emission accepted it tends to , of width . Meanwhile as the pinhole closes. The narrower normalized curve therefore accompanies a vanishing detected signal; peak normalization must not conceal that loss.
Opening the pinhole increases accepted in-focus and out-of-focus photons; closing it strengthens confocal optical sectioning while discarding some useful in-focus photons too. In the synthetic model, transmits approximately of the collected in-focus emission. At the corresponding peak-normalized signals are about . These are calculated fractions under stated assumptions, not instrument measurements.
An Airy unit conventionally specifies a pinhole diameter equal to the first-zero diameter of the emission Airy disk in that plane. For an ideal circular pupil,where is the total specimen-to-pinhole magnification, the emission wavelength in vacuum, and the objective numerical aperture. A software setting needs its specified wavelength and relay magnification; it is not a universal micrometre diameter. [ref]
Confocal microscopy (chapter manuscript) by Brad Amos and others. Appendix §6, manuscript pp. 42–43: Airy unit defined between the focal spot's zeros and conversion to real units
For ideal independent counting, accepted source and background means and give photon shot noise with variance and signal-to-noise ratio in photon counting . Closing a pinhole need not improve that ratio: it depends on how both and change. Increasing exposure or excitation to replace discarded photons can cause bleaching, an irreversible loss of fluorescent emission capacity, or damage. Detection rejection occurs after excitation and therefore does not undo excitation outside the selected depth. Such material can absorb illumination and emit photons even when their emission is omitted from the recorded image.
A useful motivating experiment moves a bead emitting fluorescence through the selected optical focus and records the detector signal against position. Measurement of point-spread function (PSF) for confocal fluorescence microscopy by InCheon Song and others (2005, §2 and Fig. 1) describes a laser delivered through a single-mode optical fiber, collimation, beam-size adjustment and a dichroic beam splitter. A , numerical aperture oil-immersion objective optical lens excites slide-mounted fluorescent beads and collects their emission. Emission passes a filter and collecting optical lens, then a pinhole, before an avalanche photodiode. A three-dimensional positioning stage moves the specimen. The apparatus also contains a phase plate for deliberately modified responses.[ref]
Measurement of point-spread function (PSF) for confocal fluorescence microscopy by InCheon Song and others. §2 and Fig. 1, pp. 2–3: apparatus and readout
The published comparison uses nominal bead diameters : larger beads give broader measured spots. This is a control on the finite emitter, because the image is the convolution of bead emission with the confocal point spread function. The smallest bead has weaker signal relative to noise; incorrect bead size, defocus, bleaching and optical aberrations limit inference from a restored response. The reported bead-size comparison concerns lateral responses; it is not a measured pinhole-size series or a measured sheet-sectioning curve.[ref]
To test axial pinhole selection with this kind of apparatus, the following is a proposed extension, not an additional result from that paper. Choose an isolated bead small relative to the response, centre it laterally, then step through optical focus while recording background-subtracted signal at several pinhole settings. Hold excitation power, dwell interval, detector gain, emission band and sampling fixed. Preserve raw peaks before also plotting peak-normalized traces. A lower peak and faster relative decay with axial displacement would support the paired-selection mechanism; fitting only normalized widths would miss the throughput cost.
Measure blocked-excitation background, include a bead-free region, avoid detector saturation, and repeat scans in reversed order to reveal drift or bleaching. Check pinhole centring separately, since misalignment can mimic signal loss. Record bead diameter, immersion medium, refractive index, numerical aperture, wavelengths and axial step. A finite bead is an approximation to an optical point source; a point trace does not certify confocal optical sectioning of a whole fluorescent sheet. Depth-dependent spherical aberration, scattering and sample motion can broaden or distort the response. Increasing magnification or making a display brighter does not correct those effects.
Immunofluorescence localizes antigens using antibodies and a fluorescence readout. Indirect labeling uses a secondary antibody to detect the bound primary antibody.