A Hertzsprung-Russell diagram plots stellar luminosity against effective temperature or a calibrated spectral classification. Conventionally, high luminosity is upward and high temperature is to the left. The Stefan–Boltzmann law, , explains why stars of equal temperature but different luminosities must have different stellar radii.
The main sequence crosses the diagram, giant stars occupy a luminous region, and white dwarfs lie at low luminosity despite their high temperatures. An evolutionary track follows one model star through this space; a population diagram instead combines many stars at once. A colour-magnitude diagram is the observational counterpart, requiring distance, extinction and spectral calibration for the conversion.
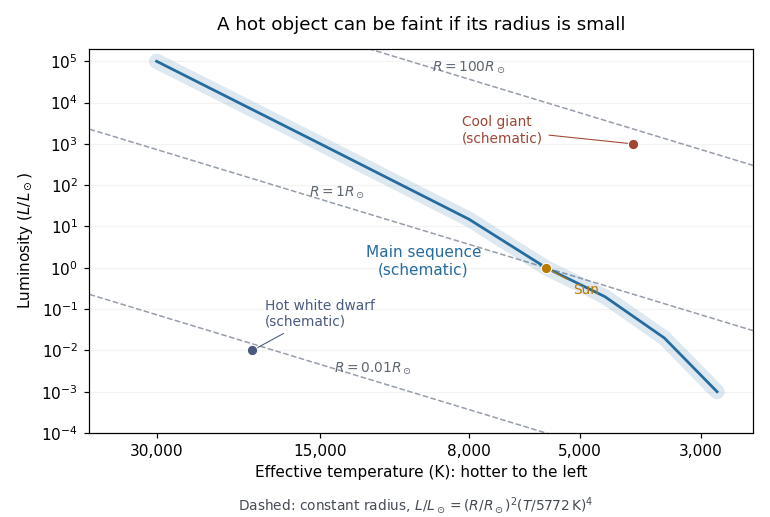
Schematic Hertzsprung-Russell diagram with lines of constant stellar radius
. The main sequence curve and giant/dwarf positions illustrate regions rather than measured population data. The dashed lines follow the Stefan–Boltzmann law; the Sun normalizes the axes. Details.The population sequence connecting the main-sequence turnoff to the lower red giant branch in a coeval stellar population, tracing post-core-hydrogen-burning evolution before the large red-giant expansion. It is a feature of a population diagram associated with subgiant stars, rather than a separate universal line followed by every stellar mass.
The instability strip is a region of the Hertzsprung-Russell diagram in which certain stellar oscillations grow because pulsation driving exceeds damping. For the classical Cepheid instability strip, partial ionization zones enable the kappa mechanism. Their heat-exchange times and location inside the star determine whether they can supply positive work to a mode.
The boundaries are physical stability limits, rather than lines marking a new fuel source. Moving to a different effective temperature changes the relevant layers and the role of convection, which can remove or redistribute the heat needed for driving. A star can cross the instability strip during stellar evolution and temporarily become a variable such as a Cepheid variable. Different classes and modes need not share identical boundaries.
The Cepheid instability strip is the region of the Hertzsprung-Russell diagram where Cepheid variables are unstable to pulsation driven by the opacity mechanism.