The messenger RNA has steady state . Since biological translation produces proteins at rate , setting the protein degradation rate equal to this production rate givesThe translational burst size is the expected number of proteins made during one messenger RNA lifetime, whose expected value is . It is dimensionless, rather than a production rate. With independent Poisson process translation and an exponential distribution for the lifetime, the resulting count has a geometric distribution on nonnegative integers with expected value and variance .
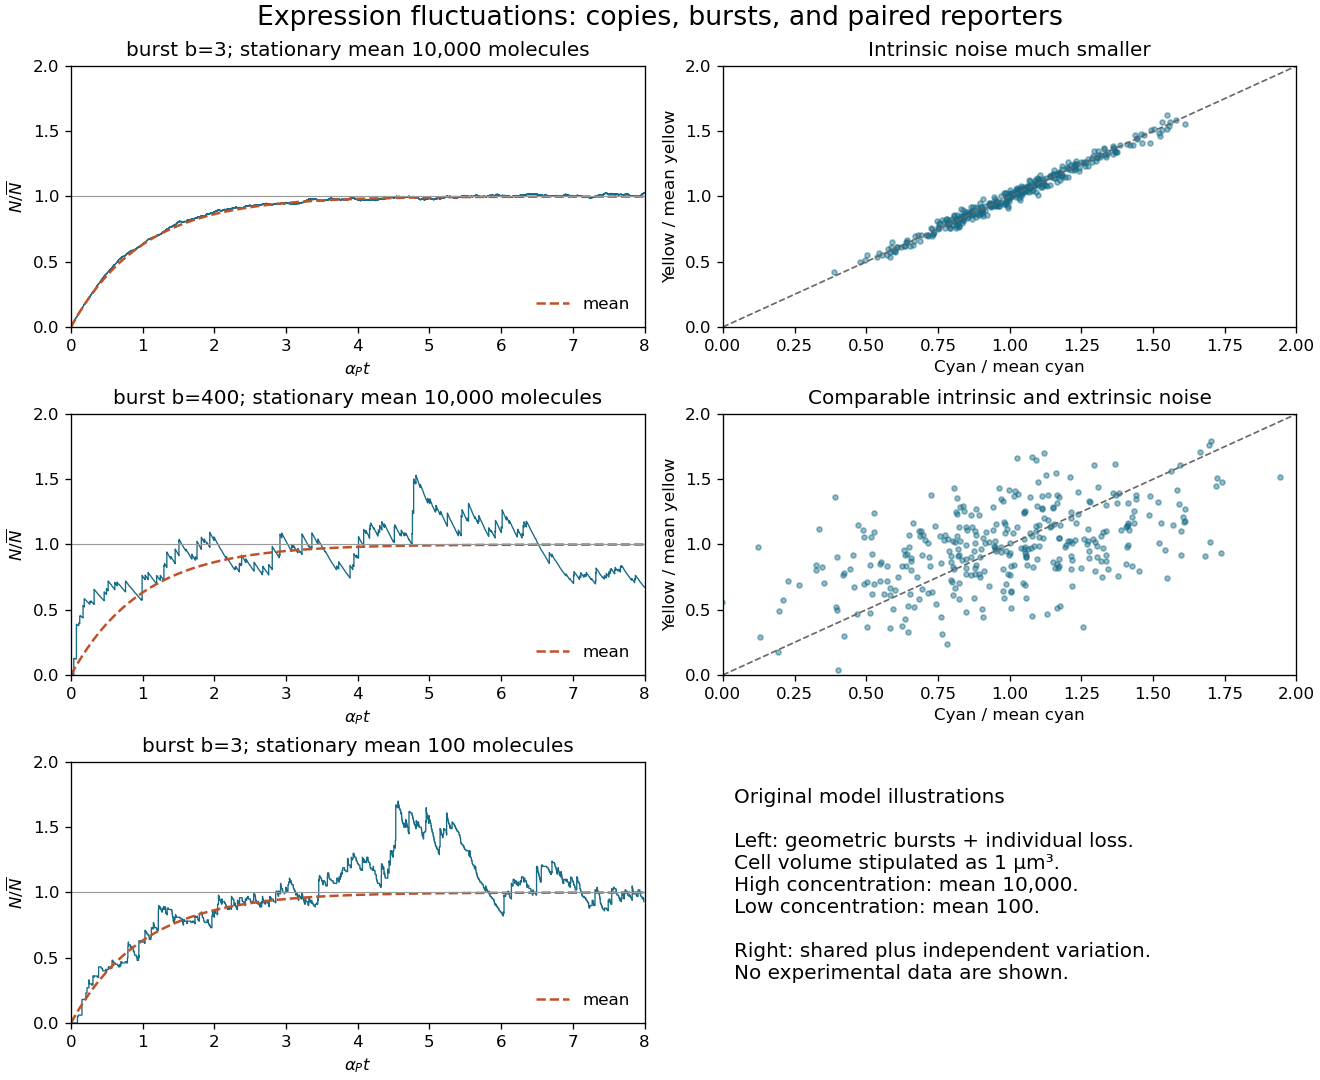
With zero initial messenger RNA and protein concentration, solving the two linear ordinary differential equations in sequence givesThe last expression applies after the short messenger RNA transient when . All three mean curves have this shape. At a fixed steady state, a larger translational burst size requires fewer transcription events: . Thus gives infrequent large upward jumps followed by protein degradation, whereas gives many smaller jumps and a smoother trace.
Noise depends on molecule counts. If the fixed cell volume is , write . In the instantaneous-burst limit, independent Poisson process arrivals of geometrically distributed bursts, with count arrival rate , and unit protein degradation giveIndeed, the moment equations are and . With zero initial counts the variance becomes . These equations explain both the approach to the steady state and the scatter about it.
For illustration only, gives at the higher concentration: the two values of the coefficient of variation are and . At the lower concentration, and gives . Decreasing the concentration by a factor of 100 therefore increases relative fluctuations tenfold, despite keeping small bursts. Absolute fluctuation sizes cannot be inferred without a cell volume. The original sketches below stipulate that volume; they are model realizations, not source data.[ref]
Transient protein-count variance in the instantaneous-burst model. Derivation of the transient and stationary variance
Translational burst size, relative expression fluctuations, and paired fluorescent reporters
. Details. 
Normalize both fluorescent reporter intensities by their respective means, correcting unequal brightness and background, and denote them . Extrinsic gene-expression noise changes shared cellular conditions and moves both signals together: the scatter is a long narrow cloud around . Intrinsic gene-expression noise comes from distinct random expression events in the two genes and broadens the cloud across that diagonal. Comparable contributions therefore give a noticeably wider, still positively correlated cloud. The two right-hand panels in the preceding original illustration show these two cases.
For matched fluorescent reporters with conditionally independent intrinsic fluctuations and corrected measurement noise,The first quantity measures differential variation; the second measures common variation. A clone's successive observations can remain correlated in time, so they need not be independent samples. Shared activation transients should also be separated from the fluctuations of interest.[ref]
Stochastic Gene Expression in a Single Cell by Michael B. Elowitz and others. Science 297 (2002), pp. 1183–1186: dual-reporter discrimination of intrinsic and extrinsic variation
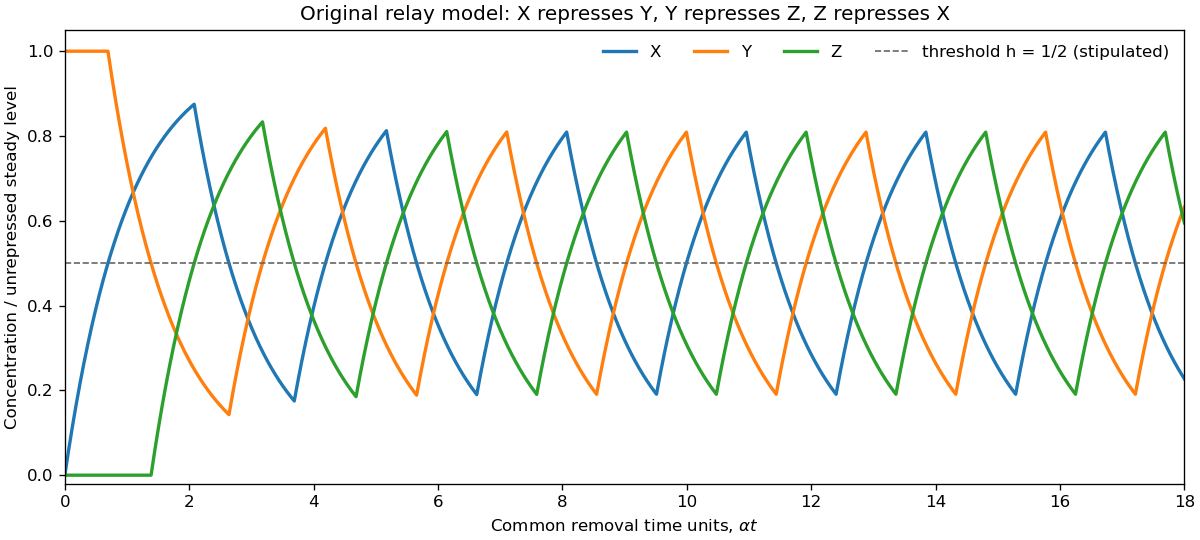
Let be the unrepressed steady state, , , and . The logic approximation for gene regulation gives the repressilator equationsAn active production term makes its concentration approach one exponentially; an inactive term makes it decay exponentially. Oscillations require an accessible threshold, . Equal thresholds and rate constants alone do not specify a numerical period.
Initially , so , , until reaches at . Then production stops and . It reaches after another , allowing production. When rises through , production stops. As falls through , production resumes; its next upward crossing represses . The downward crossing of then restarts . This ordered sequence repeats, giving displaced pulses and rounded exponential rises and falls.
Every event can be constructed without a numerical differential-equation solver: a rising variable starting at takes to reach , while a decaying variable starting at takes . Advance all three variables with their current production terms to the earliest such event, switch the affected production term, and continue. The original plot uses the explicitly illustrative choice . If , the unrepressed levels cannot cross the threshold and this oscillatory sequence does not follow.
Original logic approximation for gene regulation trajectory of the repressilator, with threshold one half of the unrepressed level
. Details. 
A green fluorescent protein readout follows the corresponding periodically regulated expression, so an individual cell has repeated peaks in fluorescence. Biological translation, fluorophore maturation, and protein degradation introduce a delay and smooth the peaks. For a simple mature fluorescent reporter with periodic production , gives . A long lifetime therefore makes the modulation weak about an accumulated background. Intrinsic gene-expression noise makes successive peak heights and periods irregular; averaging cells with unrelated oscillation phases can hide the single-cell oscillations.
Articles by others on the same topic
There are currently no matching articles.