The lower curve is a valence band and the upper curve is a conduction band, separated by an indirect band gap. The readable upper curve has a minimum just inside the X boundary and slightly below the plotted chemical potential. It is therefore partially occupied, while the visible valence states lie below the chemical potential and are filled at low temperature. The sample is electron-doped, with electron pockets around the six symmetry-related conduction minima of silicon.
The full high-symmetry path and part of the lower-left dispersion are absent from the held image. Source gap: those missing path labels and curve segments cannot be read or reconstructed from this copy. The identification of the conventional six silicon valleys and the valence maximum at uses the usual silicon band model, rather than purported readings of missing pixels.
Two methods for calculating such an electronic band structure are density functional theory, solving a self-consistent periodic electronic problem, and a tight-binding model, diagonalizing a hopping Hamiltonian built from localized atomic orbitals. Neither is a measurement of the plotted dispersion relation.
For a nondegenerate band , define the reciprocal effective mass tensor byIt is the curvature tensor of the energy band. Near an extremum, , so positive principal curvatures give positive electron effective masses. Together with the group velocity and , it yields . Negative electron curvature at a valence band maximum is conventionally recast as a positive band effective mass for missing electrons.
In a parabolic conduction valley, . The Lorentz force on an electron gives . In the principal axes of the stated effective-mass tensor,Call the matrix on the right . Its characteristic polynomial isOne mode has zero frequency, corresponding to constant drift along the field; the other two have eigenvalues . ThusMore generally the ellipsoidal cyclotron mass is . The tensor axes must be rotated for the differently oriented valleys.
The photon energy fixes the resonant cyclotron frequency by . ConsequentlyRead the two absorption maxima as approximately -- and . For , the two valleys whose long axis is along have , whereas the other four have . HenceFor the representative reading , the values are and . The graph does not warrant additional precision. The larger longitudinal effective mass means flatter dispersion and a longer constant-energy ellipsoid along the valley axis.
For , its squared projection onto the long axis of every valley is . All six valleys therefore have the same cyclotron effective mass:At the fixed photon energy,Thus the two-peak spectrum is replaced by one peak near . The source does not determine the linewidth or absolute oscillator strength for the new direction; the sketch below shows only a normalized illustrative line at the computed position.
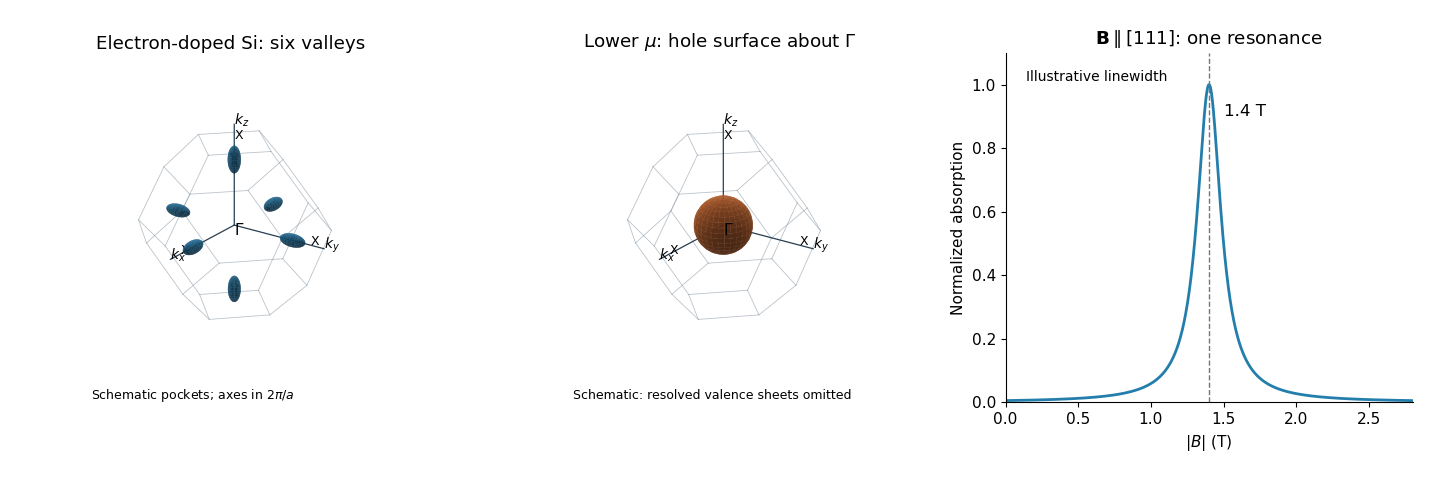

For the electron-doped sample, sketch six closed ellipsoids centred on the --X axes, just inside the six square faces of the face-centred-cubic first Brillouin zone, with long axes pointing radially toward X. In the parabolic approximation,The radial-to-transverse semiaxis ratio is . The readable conduction minimum near X and its crossing of support these electron Fermi surface pockets. The two cyclotron resonance fields arise from the two distinct orientations of the six ellipsoids, rather than two unrelated carrier species. The left panel of the original sketch includes axes, , and the three positive-axis X points; the negative-axis X points are symmetry-equivalent.
The surviving valence maximum lies roughly below the original . Lowering by therefore places it in the upper valence band in the conventional silicon band interpretation. The electron pockets disappear and one sketches a hole pocket centred at , as in the middle panel. Detailed valence-band warping and the number of spin-orbit-resolved sheets cannot be extracted from the damaged figure, and the single drawn surface is schematic rather than a claim that all such sheets coincide.
A discriminating physical property is the Hall coefficient: electron-dominated transport gives a negative value, whereas hole-dominated transport gives a positive value in the ordinary single-dominant-carrier regime. One should not infer a numerical resistivity change without the carrier densities and mobilities.
Articles by others on the same topic
There are currently no matching articles.