In near-edge X-ray absorption fine structure, a photon promotes a core electron into an unoccupied molecular or solid-state level. Near an oxygen K-edge this is principally an O excitation. Bound or resonant final states, orbital symmetry, local bonding and multiple scattering shape the edge. A monochromatic tunable X-ray beam can measure transmission through a thin specimen, or fluorescence or electron yield as an absorption proxy. In scanning transmission X-ray microscopy, a focused spot is scanned while transmitted intensity is recorded; energy stacks across an edge distinguish regions with different chemistry even when their thicknesses are similar. A zone plate or another suitable X-ray optic sets spatial resolution, while energy resolution and reference spectra control chemical discrimination.
The dipole transition amplitude contains , so the incident electric-field direction selects final-orbital orientations. For an approximately free diatomic molecule with axis , the axial transition has strength proportional to . Summing the two perpendicular directions gives strength proportional to , with separate radial matrix-element factors for the two resonance families. This NEXAFS orientation dependence of a diatomic molecule explains the complementary polarization behavior; the molecular axis is not itself the direction of a orbital.
In the supplied geometry, normal incidence has electric field parallel to the surface, whereas near-grazing incidence with the illustrated polarization has a large surface-normal field component. The single-layer curves show a stronger resonance and much weaker structure in the latter geometry. This is consistent with oxygen axes lying largely parallel to the surface: a normal electric field is perpendicular to those axes and excites efficiently, while suppressing the axial transition. For flat molecules with random in-plane azimuths, the ideal axial factor is for a tangential field and zero for a normal field.
The multilayer curves instead have a strong peak at normal incidence and substantially stronger relative response at grazing incidence. Their axes therefore have a substantial surface-normal component, consistent with the proposed tilted, more upright packing. The distinction supports a different orientation distribution in the multilayer and monolayer, rather than one isotropically oriented molecular population in both.
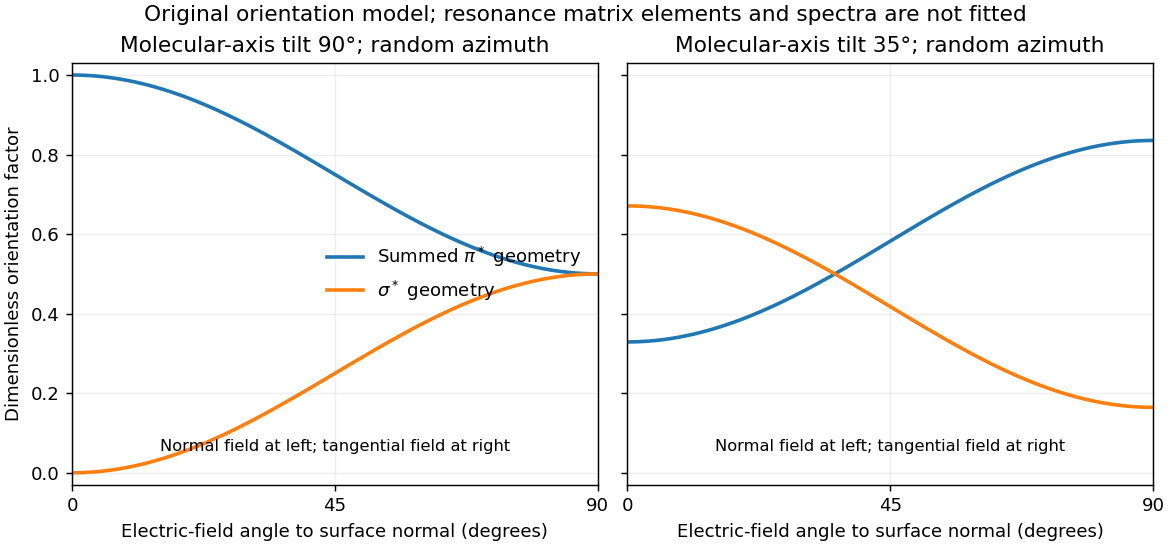

For illustration, a molecular polar tilt and random azimuth give , where is the electric-field angle to the surface normal. The original diagram plots these ideal factors for two chosen tilts; it is not a reconstruction or fit of the supplied spectra. Quantitative tilt extraction would additionally need intensity normalization, polarization purity, azimuthal distribution and substrate-induced changes of the resonances. The spectra alone do not determine unique bond lengths or every adsorption site.
Ultraviolet photoelectron spectroscopy probes occupied valence states through photoemitted electron energies. Angle-resolved photoemission spectroscopy adds emission direction and therefore parallel crystal momentum, revealing occupied band dispersions and Fermi contours. For a clean periodic surface, modulo a surface reciprocal-lattice vector. A two-dimensional surface band has no intrinsic perpendicular dispersion; varying photon energy helps distinguish it from bulk bands, while allowing for matrix-element changes. A simple surface-state example is a parabolic band .
Scanning tunneling spectroscopy measures local differential conductance. With a suitable featureless tip and weak tunneling, samples the local density of states, giving occupied and unoccupied features on opposite bias sides. It provides spatial localization, defects and standing-wave patterns, while ordinary spectroscopy at one point does not directly give the complete momentum-resolved band structure. For the parabolic two-dimensional band, the ideal density of states has a step at its onset, while spatial interference can supply information about allowed wavevectors. Inverse photoemission spectroscopy accesses unoccupied states by injecting electrons and measuring emitted photons. Optical absorption and electron energy loss spectroscopy instead probe allowed excitation energies and collective modes, with their own selection rules and momentum ranges. These methods supply complementary information; none automatically returns the full interacting band structure without matrix elements, resolution and surface effects.
For the Pt core-level spectra, electrons suffering inelastic losses emerge with reduced kinetic energy and appear at larger inferred binding energies. Loss tails and secondary-electron contributions therefore generate the background, principally on the high-binding-energy side of a core peak. The two clean-surface components correspond to different environments of the same Pt core-level branch. The stated values imply a surface core-level shiftReduced coordination at a surface narrows the band. In a simple almost-filled-band picture, maintaining its occupation moves the band center upward relative to the Fermi level; associated local-potential changes can move core levels upward too, reducing their binding energy. This is a plausible initial-state explanation of the negative shift. Final-state screening of the core hole also matters, so the measured shift alone does not uniquely determine a local charge or separate these mechanisms.
After adsorption, Pt atoms directly bonded to CO have a different local potential, hybridization and core-hole screening. In carbon monoxide adsorption on platinum, carbon-end donation and metal-to-molecule back-donation change the Pt–CO bond and hence the Pt core binding energy. The additional weak high-binding-energy component is naturally assigned to these chemically modified surface Pt atoms. Its small weight is compatible with only a minority of surface sites being occupied; a quantitative coverage estimate requires fitted areas and appropriate attenuation assumptions.
The new component is centered at approximately – in the supplied plot. Relative to bare surface Pt at , the core-level chemical shift is thereforeUsing the bulk peak as the reference would instead give about –, which answers a different comparison. The plotted axis runs toward decreasing binding energy to the right, so the additional peak on its left is a positive binding-energy shift. The estimate is a graphical reading, with no claim to sub-tenth-eV precision or a unique charge-transfer value.
Articles by others on the same topic
There are currently no matching articles.