Historical Part III experimental condensed-matter physics papers. Availability of student answers has not been established; years with advertised answers are skipped when identified. The original public paper is linked from each solutions page.
Original public paper: Physical PDF pages 592–595. All three optional notes, both question 2 alternatives and the full microscopy question are covered.
X-ray diffraction arises predominantly from electromagnetic scattering by the electronic charge distribution. For elastic scattering, contributions from different unit cells interfere constructively at a reciprocal lattice vector, while the unit-cell structure factor weights the different atoms and their positions. The atomic X-ray scattering factor generally decreases with increasing momentum transfer because an extended electron cloud scatters out of phase with itself. Heavy atoms often scatter more strongly, making a light atom difficult to locate beside a heavy one; near an absorption edge, anomalous dispersion changes the contrast and can provide additional chemical sensitivity.
In neutron diffraction, the strong interaction with atomic nuclei supplies a short-range nuclear scattering amplitude. Its coherent scattering length depends on isotope and does not vary monotonically with atomic number; isotope substitution can therefore give useful contrast, and some light elements can be prominent. A neutron's magnetic moment also couples to magnetic moments in a specimen, so magnetic diffraction measures ordered spin structures. Absorption and incoherent scattering depend strongly on isotope as well. The nuclear scattering length is approximately independent of momentum transfer in the usual thermal-neutron regime, whereas magnetic scattering has a form factor reflecting the electronic magnetization distribution.
Electron diffraction probes the electrostatic potential of both nuclei and electrons. The electron's charge makes scattering strong, allowing thin specimens or surfaces to be studied with intense signals. Strong interaction also makes multiple, dynamical scattering more important, so electron diffraction intensities often cannot be interpreted as a simple single-scattering structure factor squared. Transmission geometry needs electron-transparent material; reflected low-energy electrons provide a surface-sensitive geometry. All three methods use phase-sensitive interference to reveal periodic structure, but their scattering interactions, penetration, sample requirements and contrast differ.
A scanning tunneling microscope can modify an adsorbate's potential landscape as well as image it. First locate the atom with a weakly perturbing tunnel-current setpoint. Bringing the tip closer strengthens tip–atom coupling. In lateral atomic manipulation, moving the tip parallel to the surface can pull or push the atom between adsorption sites; reducing the coupling afterwards leaves it at the chosen location. A change in tunneling current during the motion can signal a jump, and a subsequent low-current image checks the final arrangement.
In vertical atomic manipulation, a suitable tip interaction or voltage pulse transfers an atom between substrate and tip. The tip is repositioned and the atom is deposited elsewhere by changing that interaction again. Electric fields and inelastic tunneling excitation can also change adsorption, induce hopping or modify bonds. The useful mechanism depends on the atom, substrate, tip and bias: there is no universal pulse amplitude that works for every system. Low temperature suppresses thermal diffusion and ultrahigh vacuum helps preserve a clean, stable surface.
A motivating demonstration is IBM in atoms. Don Eigler and Erhard Schweizer used a low-temperature STM to position individual xenon atoms on a nickel surface, constructing a chosen atomic pattern. The 1990 paper reported operation at about with atomic positioning precision. This demonstrates controlled rearrangement of surface adsorbates, rather than making the image alone prove that every STM feature is an isolated atom.[ref]
Positioning single atoms with a scanning tunnelling microscope by Don Eigler and Erhard Schweizer. 1990 abstract: low-temperature positioning of individual xenon atoms on single-crystal nickel
In inelastic scattering, the probe transfers energy as well as momentum to the specimen. A neutron, X-ray or electron can create or annihilate a phonon, while electronic or magnetic excitations provide other channels. Measuring the incident and outgoing energies resolves the transfer ; their wavevectors determine momentum transfer . In a crystal, phonon momentum is conserved modulo a reciprocal lattice vector. Resolved spectra therefore probe excitation dispersions and lifetimes, rather than only average atomic positions.
Thermal diffuse scattering arises from thermally populated lattice displacements and their correlations. The equilibrium lattice produces sharp Bragg peaks, but displacements redistribute part of the scattering into diffuse intensity. To one-phonon order a mode contribution contains a displacement projection and thermal occupation factors of the formwith atomic scattering weights, phases and geometrical factors understood. Stokes and anti-Stokes energy-resolved components carry and respectively; the displayed combination describes their summed scale. At high temperature, , so soft modes and their polarization strongly influence the pattern. Zero-point motion also contributes at low temperature. An energy-integrating diffraction image can record this inelastic intensity as a diffuse background without resolving its small energy transfers. Static disorder gives additional diffuse scattering, so diffuse intensity alone does not establish a thermal mechanism.
In near-edge X-ray absorption fine structure, a photon promotes a core electron into an unoccupied molecular or solid-state level. Near an oxygen K-edge this is principally an O excitation. Bound or resonant final states, orbital symmetry, local bonding and multiple scattering shape the edge. A monochromatic tunable X-ray beam can measure transmission through a thin specimen, or fluorescence or electron yield as an absorption proxy. In scanning transmission X-ray microscopy, a focused spot is scanned while transmitted intensity is recorded; energy stacks across an edge distinguish regions with different chemistry even when their thicknesses are similar. A zone plate or another suitable X-ray optic sets spatial resolution, while energy resolution and reference spectra control chemical discrimination.
The dipole transition amplitude contains , so the incident electric-field direction selects final-orbital orientations. For an approximately free diatomic molecule with axis , the axial transition has strength proportional to . Summing the two perpendicular directions gives strength proportional to , with separate radial matrix-element factors for the two resonance families. This NEXAFS orientation dependence of a diatomic molecule explains the complementary polarization behavior; the molecular axis is not itself the direction of a orbital.
In the supplied geometry, normal incidence has electric field parallel to the surface, whereas near-grazing incidence with the illustrated polarization has a large surface-normal field component. The single-layer curves show a stronger resonance and much weaker structure in the latter geometry. This is consistent with oxygen axes lying largely parallel to the surface: a normal electric field is perpendicular to those axes and excites efficiently, while suppressing the axial transition. For flat molecules with random in-plane azimuths, the ideal axial factor is for a tangential field and zero for a normal field.
The multilayer curves instead have a strong peak at normal incidence and substantially stronger relative response at grazing incidence. Their axes therefore have a substantial surface-normal component, consistent with the proposed tilted, more upright packing. The distinction supports a different orientation distribution in the multilayer and monolayer, rather than one isotropically oriented molecular population in both.
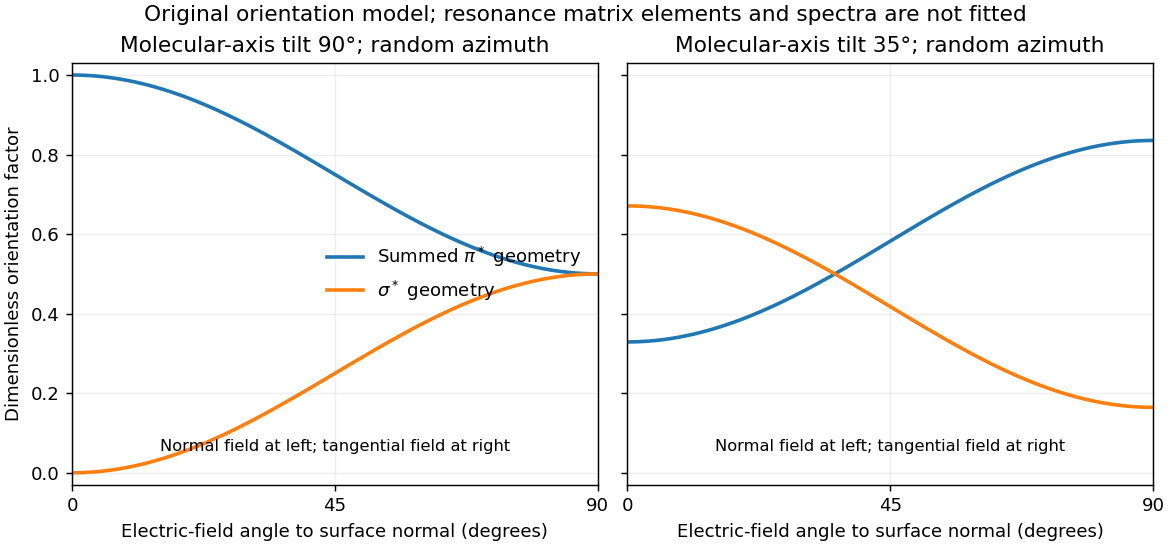
For illustration, a molecular polar tilt and random azimuth give , where is the electric-field angle to the surface normal. The original diagram plots these ideal factors for two chosen tilts; it is not a reconstruction or fit of the supplied spectra. Quantitative tilt extraction would additionally need intensity normalization, polarization purity, azimuthal distribution and substrate-induced changes of the resonances. The spectra alone do not determine unique bond lengths or every adsorption site.
Ultraviolet photoelectron spectroscopy probes occupied valence states through photoemitted electron energies. Angle-resolved photoemission spectroscopy adds emission direction and therefore parallel crystal momentum, revealing occupied band dispersions and Fermi contours. For a clean periodic surface, modulo a surface reciprocal-lattice vector. A two-dimensional surface band has no intrinsic perpendicular dispersion; varying photon energy helps distinguish it from bulk bands, while allowing for matrix-element changes. A simple surface-state example is a parabolic band .
Scanning tunneling spectroscopy measures local differential conductance. With a suitable featureless tip and weak tunneling, samples the local density of states, giving occupied and unoccupied features on opposite bias sides. It provides spatial localization, defects and standing-wave patterns, while ordinary spectroscopy at one point does not directly give the complete momentum-resolved band structure. For the parabolic two-dimensional band, the ideal density of states has a step at its onset, while spatial interference can supply information about allowed wavevectors. Inverse photoemission spectroscopy accesses unoccupied states by injecting electrons and measuring emitted photons. Optical absorption and electron energy loss spectroscopy instead probe allowed excitation energies and collective modes, with their own selection rules and momentum ranges. These methods supply complementary information; none automatically returns the full interacting band structure without matrix elements, resolution and surface effects.
For the Pt core-level spectra, electrons suffering inelastic losses emerge with reduced kinetic energy and appear at larger inferred binding energies. Loss tails and secondary-electron contributions therefore generate the background, principally on the high-binding-energy side of a core peak. The two clean-surface components correspond to different environments of the same Pt core-level branch. The stated values imply a surface core-level shiftReduced coordination at a surface narrows the band. In a simple almost-filled-band picture, maintaining its occupation moves the band center upward relative to the Fermi level; associated local-potential changes can move core levels upward too, reducing their binding energy. This is a plausible initial-state explanation of the negative shift. Final-state screening of the core hole also matters, so the measured shift alone does not uniquely determine a local charge or separate these mechanisms.
After adsorption, Pt atoms directly bonded to CO have a different local potential, hybridization and core-hole screening. In carbon monoxide adsorption on platinum, carbon-end donation and metal-to-molecule back-donation change the Pt–CO bond and hence the Pt core binding energy. The additional weak high-binding-energy component is naturally assigned to these chemically modified surface Pt atoms. Its small weight is compatible with only a minority of surface sites being occupied; a quantitative coverage estimate requires fitted areas and appropriate attenuation assumptions.
The new component is centered at approximately – in the supplied plot. Relative to bare surface Pt at , the core-level chemical shift is thereforeUsing the bulk peak as the reference would instead give about –, which answers a different comparison. The plotted axis runs toward decreasing binding energy to the right, so the additional peak on its left is a positive binding-energy shift. The estimate is a graphical reading, with no claim to sub-tenth-eV precision or a unique charge-transfer value.
Atomic force microscopy senses tip–sample interactions through a compliant cantilever. Contact deflection, oscillation amplitude, phase or resonance frequency can be converted into a feedback signal. Chemical bonding and short-range repulsion, van der Waals forces, electrostatic forces and, where relevant, magnetic or capillary interactions produce contrast. Apparent height at a fixed force or frequency setpoint can therefore contain interaction contrast as well as geometry. Lateral resolution depends on the effective tip apex and interaction range; finite tip radius broadens features. Vertical sensitivity also depends on thermal and detector noise, cantilever calibration, vibration, drift and feedback bandwidth. Strongly localized short-range forces favor atomic resolution, whereas extended interactions average over more of the tip and surface.
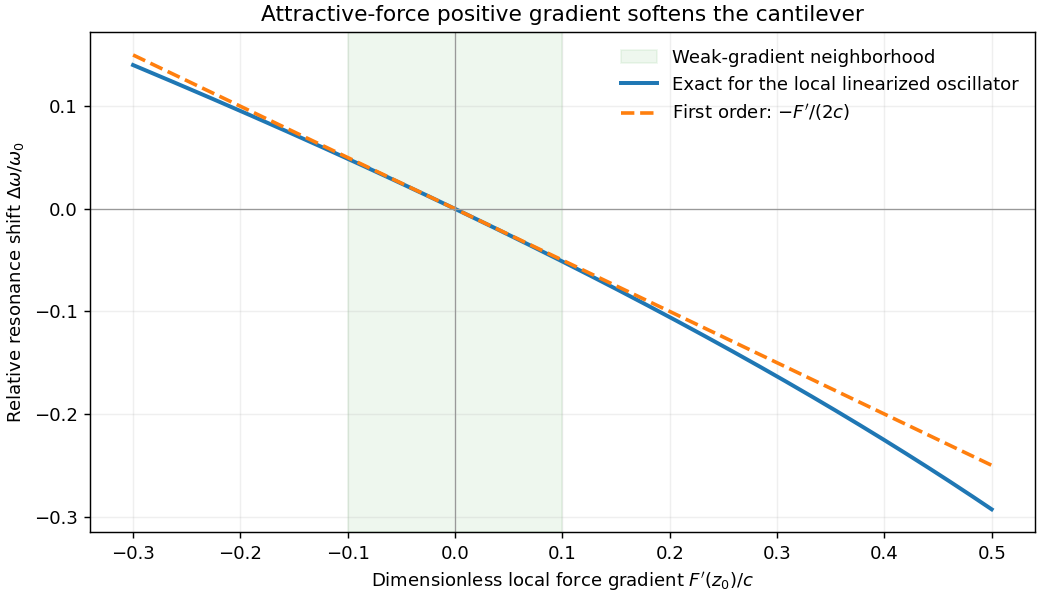
For small oscillations about equilibrium separation , write and linearize . The constant force is absorbed into the equilibrium displacement. The cantilever equation becomesConsequently the small-amplitude AFM frequency shift isThe linear expression is the small-force-gradient approximation, , in addition to the small-oscillation assumption. For an attractive force , and the resonance softens. A finite oscillation amplitude samples a weighted range of forces rather than only the gradient at one separation, and destroys local stability in this simple static model.


In a scanning electron microscope, a focused electron beam scans the surface and a detector records an emitted signal at each beam position. Low-energy secondary electrons escape from near the surface; changes in local slope, edges and detector-facing geometry give strong secondary-electron topographic contrast. Backscattered electrons result from elastic deflection of primary electrons and generally have a larger yield for higher atomic number. Their backscattered-electron atomic-number contrast therefore helps separate compositional regions. Detector geometry, crystal orientation and topography can also affect this signal, so brightness is not a unique elemental identification.
An environmental scanning electron microscope admits gas around the specimen while pressure-limiting apertures and differential pumping preserve the electron-optical column's vacuum. Electron collisions ionize the gas. Positive ions can neutralize negative charging of a poorly conducting specimen, enabling observation without a conductive coating. A gaseous secondary electron detector uses gas amplification to collect secondary-electron signals under these conditions. Gas pressure, path length and scattering must be controlled because they also affect the probe and background.[ref]
Low-vacuum SEM by JEOL. glossary entry: gas-ion charge neutralization and environmental secondary-electron detection
Finally, acquire an energy-dispersive X-ray spectroscopy spectrum at each pixel to add elemental specificity. The beam creates inner-shell vacancies, and characteristic X-rays emitted as they fill identify chemical elements. Selecting fitted characteristic-line intensities yields elemental maps that can be compared with the electron image. Peak overlap, detector response, absorption and the X-ray-generating interaction volume limit identification, quantification and spatial resolution. This gives chemical-element contrast; resolving different bonds or oxidation states generally needs more detailed spectral information than one broad elemental map.
Both neutron diffraction and X-ray diffraction use interference from atomic arrangements. Elastic scattering gives reciprocal-space peaks when the momentum transfer matches a reciprocal lattice vector. For a basis with sites , the structural amplitude is , and peak intensities constrain positions, occupancies and thermal displacement as well as lattice symmetry. Powder averaging loses some directional information that a suitable single-crystal measurement retains.
X-rays couple primarily to the electron distribution. Their atomic form factors generally favor heavier atoms and decrease with increasing scattering angle; the wavelength can also be tuned near an absorption edge for element-sensitive anomalous contrast. Neutrons scatter from nuclei with scattering lengths that vary irregularly with element and isotope. This can make light atoms visible beside heavy ones, and isotope substitution can change contrast without changing the nominal chemical element. In particular, replacing hydrogen with deuterium changes the balance of coherent and incoherent neutron scattering.
Neutron magnetic scattering also couples to electronic magnetic moments, allowing magnetic order to produce peaks distinct from the nuclear structure. X-ray magnetic scattering is possible too, especially under suitable resonant conditions; it is incorrect to say X-rays can never probe magnetism. Neutron experiments often require larger samples and dedicated sources, whereas X-ray scattering is available in laboratories as well as synchrotrons. Absorption, multiple scattering, texture and instrumental resolution affect both methods. Their complementarity comes from different contrast weights and magnetic sensitivity, rather than from two identical pictures of the same density.
In photoemission electron microscopy, illuminate a surface with ultraviolet light or X-rays and form an electron-optical image of the emitted electrons. An extraction field accelerates them away from the sample; an immersion objective and projection lenses magnify their spatial distribution onto an electron detector. Unlike a scanned probe, this is a full-field image. Surface preparation and vacuum matter because the emitted low-energy electrons are strongly affected by contamination and local electric fields.
Contrast can come from work-function differences, composition, occupied electronic states, illumination and topography. Near threshold, a small work-function change can produce a large emission-yield change. Therefore brightness is not simply geometrical height. An energy filter can select an emitted-electron energy interval; scanning the selection yields spatially resolved spectra. Sweeping the photon energy across an absorption edge can add element and chemical-state sensitivity. Appropriate polarization-dependent measurements can probe magnetic domains.[ref]
Photo emission electron microscope by JEOL. instrument definition and optional energy-filter imaging
Resolution depends on electron-lens aberrations, the accepted angular and energy spread, extraction geometry, sample flatness, space charge, mechanical stability and detector sampling. Rejecting electrons improves some aberrations at a cost in signal. An unfiltered photoelectron image and a chemically selected image therefore answer different questions even when they use the same microscope.
In X-ray photoelectron spectroscopy, the electron binding energy relative to the chosen reference follows . A core-level chemical shift is a change in a core peak's binding energy between environments. Initial-state contributions include charge redistribution, bonding, the local electrostatic potential and chemical-potential changes. Final-state contributions include relaxation and screening of the newly created core hole. The measured shift contains both; it is not a direct meter of an integer oxidation state.
For a related chemical series, electron withdrawal often raises a core binding energy, but screening and referencing can change that trend. A surface core-level shift can separate surface atoms from bulk atoms because coordination and screening differ. Adsorption can introduce another component for chemically bound surface atoms. Spin-orbit doublets, multiplet or satellite features must be distinguished from separate chemical environments.
Reliable comparison needs a consistent Fermi-level or other justified energy reference, compensation or diagnosis of sample charging, adequate energy resolution and a stated line-shape/background model. Angle or photon-energy variation changes surface weighting through electron escape depth, helping distinguish surface and bulk assignments. A shifted, broader or overlapping peak alone does not uniquely identify a chemical species or its concentration.
The large rises mark the opening of Ga and As K-shell photoionization channels at their respective thresholds. Above each edge, the outgoing photoelectron interferes with waves backscattered by neighboring atoms; that interference modulates the absorption transition probability. Near-edge resonances and multiple scattering require a different level of treatment from the simple high-energy single-scattering formula. Ga has four As nearest neighbors, while As has four Ga nearest neighbors, so the two edges sample different central atoms and scattering factors even though they probe the same nearest-neighbor bond lengths.
Write and relative to a smooth atomic background. The phase includes the outward-and-return propagation distance and atomic phase shifts. The factor describes geometrical spreading; the backscattering amplitude depends on the neighbor species. The exponential accounts for loss of coherent photoelectron propagation. Averaging over Gaussian bond-length fluctuations gives .
The printed polarization factor needs a notation correction: for K-shell dipole absorption it is proportional to , not literally the cosine of a dimensional vector dot product. Four equivalent tetrahedral bonds have an isotropic sum of these projection weights. If the sum is over shells rather than individual neighbors, it also needs the coordination number. A common conventional amplitude contains ; omitted normalization and factors must be absorbed in the printed convention rather than silently changing its dimensions.
These are the ingredients of extended X-ray absorption fine structure. A shell fit uses calculated or reference scattering amplitudes and phases, and refines bond distances, coordination and mean-square relative disorder together with an edge-energy correction. Fourier transformation separates approximate distance contributions, but the uncorrected peak position is shifted by the scattering phase and is not an exact bond length.[ref]
Fundamentals of XAFS by Matthew Newville. Chapter 3, equations 3.9–3.11 and subsequent mean-free-path correction; Chapter 6, shell fitting
Sample A has the larger Ga–As bond length. Its oscillations advance slightly faster with : at higher its corresponding maxima lie to the left of B's. Reading several full cycles gives approximate periods and . In the constant/common-phase-slope estimate, , soThis is a rough percent-level difference, not a precise fitted strain. Nonconstant atomic phase shifts affect the absolute distance inferred from a period and also limit this fractional estimate. The graph does not establish which alloy has which indium concentration or how much its bulk lattice parameter changed. Local Ga–As relaxation need not follow a uniform bulk strain exactly.
Low temperature reduces thermal relative motion, preserving high- oscillations and separating small phase changes more clearly. It does not remove zero-point motion or static alloy disorder. To obtain an illustrative disorder estimate, take the high- envelope of the plotted to fall from about at to at . If other envelope factors vary slowly over this interval,The value is only an order-of-magnitude, model-dependent reading: the backscattering amplitude, mean free path and normalization have not been independently removed. In particular, is the bond-projected mean-square relative displacement,including correlations and static disorder. It is not uniquely either atom's mean-square displacement. Equal uncorrelated projected displacements would each contribute , but that extra assumption is not supplied by the figure.
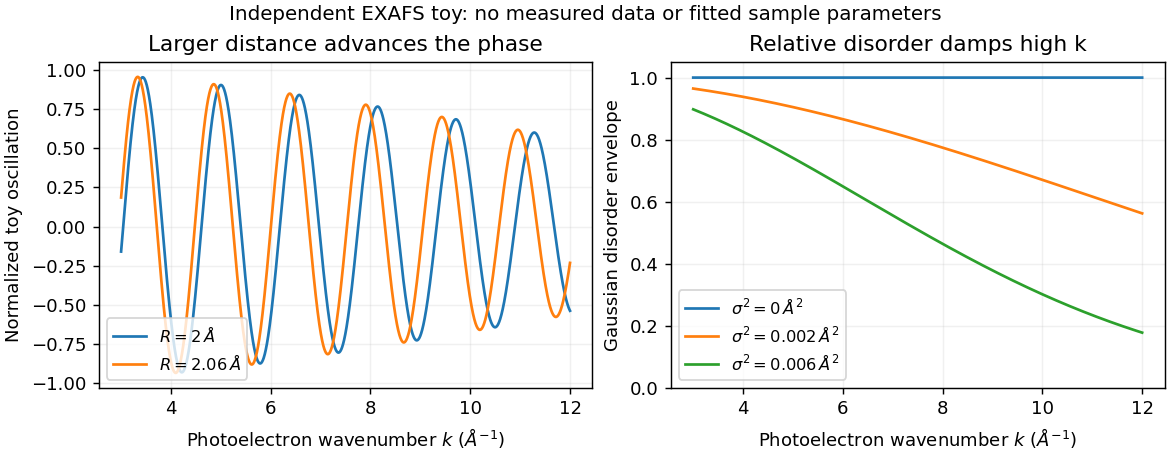
Bond distance and disorder affect EXAFS differently
. Original independent toy signals: distance changes oscillation phase, while Gaussian relative disorder damps the high-wavenumber envelope. Curves are not fits to the exam spectra or measurements. Details.
In scanning tunneling microscopy, under simplified constant-tip-density assumptions, with . A constant-current height map mixes actual surface height with local electronic density, barrier/work-function changes and tip structure. Changing bias can change contrast without moving atoms. Scanning tunneling spectroscopy instead records energy dependence, often through ; tip states, matrix elements and thermal or modulation broadening still affect its interpretation.
In atomic force microscopy, contrast comes from tip-sample forces or their gradients: short-range chemical bonding and repulsion, dispersion forces, electrostatics and sometimes magnetism or capillary forces. Contact deflection, oscillation amplitude and frequency shift are different observables. A force-gradient image can therefore differ from a geometrical-height image, and changing the tip termination can strongly change atomic contrast.
STM's exponential distance sensitivity can give excellent vertical sensitivity; usable resolution also depends on current noise, feedback, vibration and drift. Lateral contrast depends on the apex orbitals and electronic spatial extent, not merely the nominal tip radius. In AFM, broad-tip geometrical convolution broadens larger features; a sharp terminal atom and short-range forces can produce much finer atomic contrast. Cantilever stiffness, amplitude, frequency noise, force range, thermal fluctuations and feedback influence height sensitivity. In both techniques, detecting a small displacement is distinct from resolving two neighboring objects.
An example is the Cu(111) surface-state standing-wave experiment. Low-temperature STM and spatially resolved spectroscopy connect atomic steps or defects in a surface map with surrounding energy-dependent electronic interference patterns. Their period changes with bias, whereas a fixed structural corrugation would not acquire that electronic dispersion. The result shows why spectroscopic maps reveal surface-electron scattering beyond what a height image alone identifies.[ref]
Imaging standing waves in a two-dimensional electron gas by M. F. Crommie and others. 1993, observation of Cu(111) local-density-of-states standing waves
The apparent fringes are not a second set of equally spaced surface atoms.Transmission electron microscopy accelerates electrons through a thin sample, then uses electron lenses to form an image or diffraction pattern. Elastic scattering encodes projected structure and potential; inelastic scattering carries excitation and chemical information. Thin specimens reduce unwanted multiple scattering and absorption, although coherent dynamical scattering can still matter in a crystal. High-resolution phase-contrast images depend on defocus and the transfer function as well as the specimen; they are not direct height maps.
The relativistic wavelength is . A shorter wavelength permits fine resolution but does not guarantee it. A schematic probe/image blur budget contains diffraction , spherical aberration and chromatic aberration , plus source size, instabilities, specimen motion and radiation damage. Optimizing the aperture angle balances these terms; increasing accelerating voltage can also alter damage and contrast.
Bright-field imaging accepts the central transmitted beam or its neighborhood. Regions that scatter electrons outside that acceptance can appear dark. Conventional dark-field imaging selects a diffracted beam. Annular dark-field electron imaging in a scanning TEM instead collects a range of scattered angles while a probe is scanned. A sufficiently high-angle detector often gives strong atomic-number sensitivity and more nearly incoherent contrast; thickness, channeling and detector geometry prevent a universal conversion of intensity to composition.
Electron energy loss spectroscopy measures energy lost by transmitted electrons. Core-ionization thresholds identify elements, while near-edge fine structure probes bonding and unoccupied states. At successive probe positions, one can record a spectrum image or form a map from a selected edge after background subtraction. Plural scattering, edge overlap, delocalization, specimen thickness and counting statistics limit the interpretation. Chemical specificity comes from excitation energies and spectral structure, not from brightness alone.
A development already established before this 2012 paper is aberration-corrected transmission electron microscopy: multipole correctors compensate leading lens aberrations, allowing useful larger angular acceptance and finer probes. Correction does not remove every chromatic, stability or specimen limit. A concrete application was atom-by-atom annular-dark-field analysis of monolayer boron nitride with substitutional defects, resolving chemical differences between sites in a nonuniform lattice.[ref]
Atom-by-atom structural and chemical analysis by annular dark-field electron microscopy by O. L. Krivanek and others. 2010, low-voltage aberration-corrected STEM of monolayer boron nitride
Combining structural maps with spatially resolved core-loss spectra supplies another route to distinguish composition and bonding at interfaces. Both exploit a calibrated imaging or spectroscopy response rather than assuming every visible spot is chemically self-identifying. Articles by others on the same topic
There are currently no matching articles.