A kernel for density estimation is an integrable function K of unit integral, ordinarily nonnegative and centered. Square integrability is needed for integrated variance; a symmetric second-order kernel for density estimation also has and finite nonzero second moment . Its scaled form is , and the kernel density estimator isHigher-order signed kernels are possible, but need not give a nonnegative probability density function estimate.
The mean integrated squared error is . Put . Independence gives the pointwise mean and variance . Integrating, use and Fubini to obtain . The bias-variance decomposition proves the exact formulaEquivalently this is . These identities assume the displayed integrals are finite; they are exact, rather than a small-smoothing bandwidth expansion.
For a symmetric second-order kernel for density estimation, Taylor expansion gives leading bias , and the leading integrated variance is . Thus the asymptotic mean integrated squared error balances inverse smoothing bandwidth against fourth-power bias, with optimal smoothing bandwidth . Its appearance of the integrated squared density curvature motivates the scale comparison.
For , , two differentiations give . A change of variables therefore gives , which tends to zero as if the original curvature integral is finite. The distribution with probability density function is that of X divided by a, so . ConsequentlyThis scale-invariant density curvature measures shape without dependence on the units used to measure X.
For the final minimization, write and use the triweight kernel on , zero outside. Integration gives total mass one, mean zero and variance . Its value and its first two derivatives vanish at both endpoints, so its extension is twice continuously differentiable. On the interior,In particular and .
Put . The mass and moment constraints give , since both means vanish and their variances match. If the claim is immediate; otherwise expand the squared norm and integrate its cross term twice by parts over . The first endpoint term vanishes because , but the next one must be retained:For the second equality use the zero mass and second moment of e and outside the support. All terms in the last expression are nonnegative, including the endpoint values of a probability density function. It follows thatThis proves that the triweight density minimizes integrated squared curvature under the specified constraints. Equality forces ; a globally affine integrable difference of probability density functions is zero, so equality occurs only at .
The empirical distribution function is . For continuous F, the probability integral transform gives independent uniform variables . Strict increase of F is unnecessary. More explicitly, generate the observations by with the generalized quantile inverse. Then , so , where is the uniform empirical distribution.
Continuity and the limits of F ensure that its range contains . The endpoint discrepancies for are zero. Hencewhich depends only on n. Equivalently it is , a function of uniform order statistics. This proves the distribution-free property of the Kolmogorov-Smirnov statistic even when F has flat portions.
Choose from this common distribution so that . The Kolmogorov-Smirnov confidence band isThe event that all these inequalities hold is exactly the event used to choose the critical value, giving simultaneous coverage . The Glivenko-Cantelli theorem states that for an independent identically distributed sample from any distribution function, continuous or not, almost surely.
For an integrable r-argument U-statistic kernel, replace it by . Every permutation has the same expectation by exchangeability, so this symmetrization of a U-statistic kernel preserves the target functional. For a symmetric U-statistic kernel h and , the U-statistic isEach summand has expectation theta, hence the statistic is unbiased.
For the population variance, use . Independence gives when the second moment is finite. The corresponding statistic simplifies using :Thus variance as a U-statistic is precisely the usual unbiased sample variance, for .
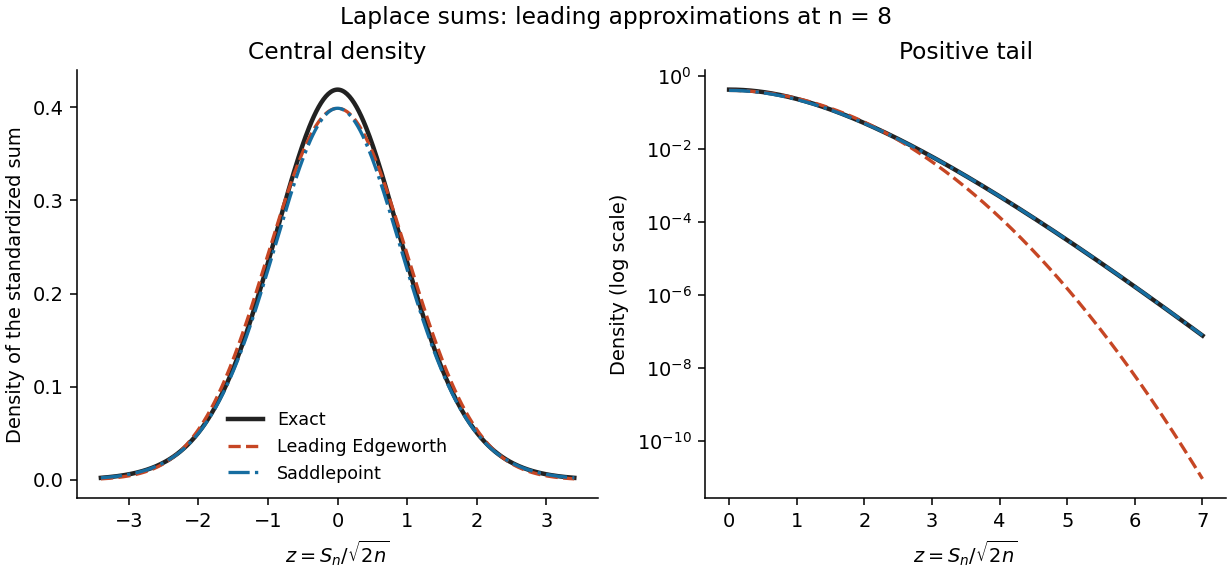
Let the summands have mean mu, variance , and cumulants . For the standardized sum , expansion of its log-characteristic function gives a normal leading term and successively smaller cumulant terms. Fourier inversion turns these terms into Probabilists' Hermite polynomials. Under sufficient moments and a smooth nonlattice condition, the Edgeworth expansion beginsfor bounded z. Higher orders include the fourth cumulant and products of lower cumulants. This is a central expansion in powers of ; it need not remain positive, normalized, or accurate in far tails after truncation.
For a saddlepoint density approximation, require the summand cumulant-generating function K to be finite on an interval about zero. At a sum value , find the interior saddle satisfying . Exponential tilting makes the tilted mean y, so the tilted sum is approximated locally by its normal probability density at its mean. Undoing the tilt givesEquivalently this follows by deforming the transform-inversion contour through its stationary point. Suitable analytic and nonlattice regularity gives relative error at fixed interior y. This approximation incorporates a nonquadratic tail exponent and is positive, while an Edgeworth truncation uses a normal probability density times a polynomial. It uses more information from the distribution and stronger exponential-moment assumptions. Its integral may differ from one by a higher-order amount, so positivity does not imply exact normalization.
For the centered Laplace distribution, , hence and . Its skewness vanishes, so the order- Edgeworth correction is zero. With , the requested expansion, omitting terms of order in the standardized correction, isFor bounded z the exact probability density function is this expression times . The prefactor is because this is the probability density function of the unstandardized sum; that change of units should not be confused with the orders inside the Edgeworth expansion.
For the saddlepoint, . Write and . The root in isThese formulas include without a division by y. Substitution yieldsThis is the leading saddlepoint approximation, without its order- relative correction. Expanding d near one recovers the same central normal approximation, while retaining d captures the Laplace-sum large-deviation exponent away from the center.

Assume a symmetric second-order probability density function kernel for density estimation and enough smoothness for the displayed derivative functionals. The benchmark smoothing bandwidth is , balancing against . Three widely used selection methods are as follows.
For least-squares density cross-validation, expand integrated squared error as . Estimate the middle integral by leaving out the observation at which the estimate is evaluated, and minimizeThe left-out observation is independent of its estimator, so the second term has expectation . Thus exactly. The subtraction of the self-contribution is essential. Computation uses , where . This method directly targets integrated error without estimating a curvature functional first. Under standard smoothness and a suitable search interval its selected smoothing bandwidth is ratio-consistent with the MISE optimum, and hence with . Relative fluctuations are ordinarily , so the selected values can be quite variable in finite samples.
For biased density cross-validation, estimate curvature from the second-derivative probability density function estimator and subtract its diagonal variance term:Differentiating the kernel for density estimation estimator and applying the integrated-variance identity gives the exact expectation . Under the derivative regularity assumptions, , so . Minimize BCV over a reasonable smoothing bandwidth range. It is a smoothed criterion directed at AMISE; the name reflects its finite-sample bias rather than an exact unbiased-risk identity. Standard conditions again give ratio consistency and relative fluctuation order . It often has a smoother objective than ordinary least-squares cross-validation, though numerical behavior and relative variance depend on the probability density function and kernel for density estimation.
For plug-in bandwidth selection, obtain an independent pilot scale g, estimate , then setThe pilot should be positive and stable; consistent positive estimates make this expression ratio-consistent by continuity. A simple normal-reference initialization uses under a normal reference model, substituting a sample scale for sigma. For a Gaussian density kernel this gives . A pure normal-reference rule is quick but is asymptotically correctly calibrated only when its assumed curvature matches the actual probability density function; it is useful as the first stage of a data-driven plug-in procedure.
A more adaptive fourth-derivative pilot estimate of density curvature uses , obtained by two integrations by parts, and estimates it byThe diagonal expectation contributes ; the leading smoothing bias is . Balancing these terms produces the stated pilot scale , with another pilot or reference model supplying . Under sufficient derivatives and tail control, its error is bounded byat that pilot scale. Taylor expansion of the fifth-root formula gives , so it inherits that bound. A calibrated cancellation of leading pilot bias can give a faster rate. This illustrates why an appropriately constructed plug-in selector can converge more quickly than cross-validation, while requiring more smoothness and pilot choices. For each ratio-consistent method, its attained AMISE divided by the minimal AMISE tends to one.
A marginal statistical likelihood uses a statistic whose marginal sampling distribution depends on the parameter of interest but does not involve the nuisance parameter. It integrates out other observed coordinates. A profile likelihood instead keeps the full data and, for every fixed interest parameter, fits the nuisance parameter by maximizing the full likelihood. Profiling supplies a likelihood function but usually not a normalized sampling probability density function. Here the marginalization is of data coordinates; Bayesian model evidence averages parameters against a prior and is a separate construction.
Use shape-rate notation for the gamma distribution. The independent sums have and , so their joint probability density for isFor , the absolute Jacobian determinant is u. ThereforeIntegrate u using the gamma integral . The lambda factors cancel, leavingThus T gives a nuisance-free marginal likelihood. Discarding only terms independent of psi, its logarithm isThe factor t in the logarithm is required, as in the original PDF.
The full log-likelihood is . Its lambda derivative vanishes uniquely atThe second derivative in lambda is negative. Substituting this maximum gives . Since , it agrees with up to a psi-independent constant. This proves the Gamma-ratio marginal and profile likelihood identity. Their common maximizer is , if an interest-parameter estimate is also wanted.
In a regular model let be the log-likelihood, its score, its total Fisher information, and the unrestricted maximum-likelihood estimator. For a point null in a p-dimensional parameter space, the standard statistics areThese define the Wald test, score test and likelihood-ratio test. With an interior true parameter, increasing information, suitable differentiability and asymptotic normality, all have asymptotic chi-squared distribution with p degrees of freedom under the null. Observed information can replace expected information when it is asymptotically equivalent.
For q smooth independent restrictions , replace the Wald statistic by , where G is the derivative of g at the estimate; compare with chi-squared q. The likelihood-ratio statistic uses the difference between unrestricted and null-restricted maxima. The score statistic is computed at the restricted maximum and uses efficient information for the tested coordinates: with nuisance coordinates lambda this is . Inverting the acceptance inequalities for point nulls produces approximate coverage- confidence regions; for example the Wald region consists of theta satisfying . Analogous score and likelihood-ratio inequalities give their confidence regions.
For the Poisson family, put to include the initial observation, and defineMultiplying the initial and conditional Poisson probabilities gives, on the supported observation sequences,The parameter-free term is , interpreting as zero. A positive count after a zero preceding count is outside the support.
For , strict concavity gives unconstrained maximum , and the upper endpoint restriction givesThere is an endpoint qualification in the printed question. With probability , and all later counts are zero. Then , and the likelihood is , which has no maximum on the stated space . The formula produces zero only as an extended estimate on the closure . This is a likelihood supremum at an excluded boundary, and zero cannot be called an actual maximum in the original space.
The observed negative second derivative is . Conditional expectation gives and . Therefore for ,This is the bounded information in a subcritical Poisson branching process. Observing more generations of one family does not provide unbounded information. Indeed , and zero is absorbing, so extinction occurs at a finite generation almost surely. The total observed progeny is finite; eventually , , and the extended estimate equals , a discrete nondegenerate random variable rather than a consistent increasingly precise estimate.
Here is a direct proof of the failure of a chi-squared Wald limit which does not rely solely on the information bound. Under any interior null , the event , has probability and forces every later count to be zero. On it the genuine constrained estimate is for every , so the usual expected-information Wald statistic isThus it has a persistent atom tending to . The fact that atoms obstruct a continuous distributional limit rules out a chi-squared limit, including when equals one half and that atom is at zero. Any definition adopted for the separate all-zero sample event leaves this positive-count counterexample intact. Hence the Wald statistic does not have the usual asymptotic chi-squared null law for this increasing observation horizon.
Articles by others on the same topic
There are currently no matching articles.