The Lyman-alpha forest is the large collection of narrow Lyman-alpha absorption features in the spectrum of a distant quasar. Neutral hydrogen in foreground gas absorbs at its own redshifted resonance, so an absorber at places its feature atOrdinary intervening absorbers have , putting their Lyman-alpha lines blueward of the quasar's own broad Lyman-alpha emission. Many different absorbing patches along the same line of sight make the forest; they are not different transitions of one cloud. At sufficiently short wavelengths higher Lyman-series transitions can overlap the forest, so an actual analysis identifies these blends rather than treating every dip as isolated Ly-alpha.
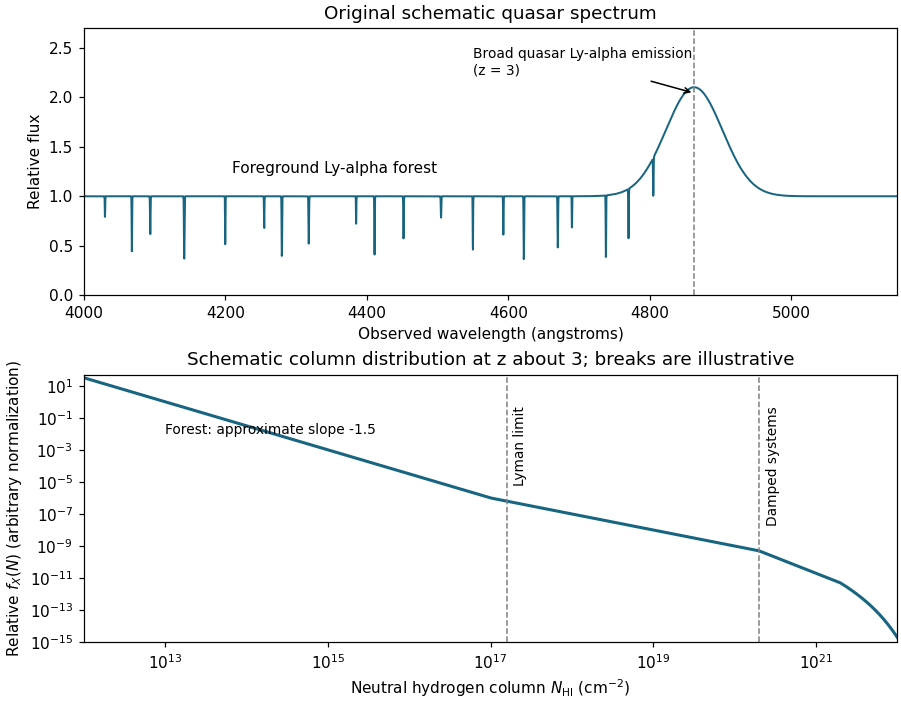
Schematic quasar Lyman-alpha forest and neutral-hydrogen column-density distribution at redshift three
. Details. 
The upper panel is an original schematic spectrum for , with absorption features at smaller cosmological redshifts and a broad emission feature near Å. The lower panel anticipates the column-density discussion: both curves are teaching sketches, not measured spectra or fitted survey distributions. The ordinary Lyman-alpha forest mainly traces the fluctuating, photoionized intergalactic medium, rather than a collection of identical isolated, neutral clouds.
Hydrogen is the most abundant element, and its Lyman-alpha line is a strong resonance from the ground state. Very small neutral fractions in an otherwise ionized intergalactic medium therefore produce detectable Lyman-alpha absorption. A long quasar sightline samples a great many modest density enhancements in the cosmic gas, with a much larger covering area than the compact high-column regions that produce damped Lyman-alpha systems.
Heavy-element absorption additionally requires metal enrichment and enough ions in the relevant ionization state. Many weak Lyman-alpha forest absorbers contain too few such ions to produce detectable metal lines at the same sensitivity, while high-column Lyman limit systems and damped Lyman-alpha systems are intrinsically rarer. Thus abundant hydrogen, a sensitive resonance and the large interception area of diffuse gas together explain the forest's numerical dominance. The comparison is between absorber classes at specified observational sensitivity; it does not mean that a metal-rich system has only one spectral transition.
Typical weak Lyman-alpha forest absorbers have neutral hydrogen column densities roughly –, with stronger forest absorption extending towards . Common Doppler broadening parameters are a few tens of , consistent with gas at approximately K together with bulk velocity gradients. The thermal contribution isA line width is consequently a temperature upper bound if all other broadening is neglected, not a unique thermometer. The gas commonly lies in diffuse sheets and filaments at modest density contrast; only the strongest systems need substantial self-shielding or a galactic environment.
For optically thin gas illuminated by the cosmic ionizing background, photoionization equilibrium requireswhere the last approximation uses almost complete hydrogen ionization. For example, , and give . A kpc path then has despite its tiny neutral fraction. This illustrates the Lyman-alpha forest photoionization scaling: low density makes the two-body radiative recombination rate weak relative to the one-body photoionization rate, but a long path and a strong resonance still produce measurable absorption.
Independent information is important because a column density alone is not a volume density. Similar absorption in close pairs of quasars indicates substantial transverse coherence, while an ionizing optical depth shows that these weak systems do not shield themselves from the background. The continuum-shielding threshold is . Together with the observed line widths and ionization balance, these facts favor extended, low-density, highly ionized gas over small cold neutral clouds. The physical interpretation and characteristic scales are consistent with Rauch's forest analysis and the measured column and line-width distributions.
Specify the path convention before integrating the neutral-hydrogen column-density distribution. Write and , with absorption distance satisfyingThe lower panel of the preceding sketch shows the approximate decrease of with near . Ordinary forest columns are roughly described by , , but the slope changes through partially shielded Lyman limit systems and high-column damped Lyman-alpha systems. No single slope should be extrapolated through all these regimes. In logarithmic bins the number is , whereas their neutral mass contribution is proportional to ; confusing these two weightings would give a wrong baryon inventory.
To derive the neutral gas density from an absorption distribution, a redshift interval has proper light-path length . The sum of neutral hydrogen columns per path length estimates the mean proper number density:The proper mass density is ; division by converts it to a comoving mass density. Thus, with today's critical density ,A representative finite-sample estimator replaces the last integral by , with completeness and selection corrections. This defines a comoving inventory divided by today's critical density; a fraction of the instantaneous critical density has a different normalization. Neutral gas including accompanying helium is obtained by multiplying by a specified mass correction, approximately ; hydrogen-only must not silently include it.
At the observed neutral inventory is of order , far below the cosmological baryon density of order – for . High-column damped Lyman-alpha systems contribute most of this neutral mass although weak forest lines dominate the counts; for the mass per logarithmic column interval increases as in the forest regime. The small neutral inventory therefore does not imply a small total gas inventory: the intergalactic medium contains a large ionized baryon reservoir invisible to a neutral-only count. Recovering that reservoir requires an ionization correction and a gas-density model. The survey normalization and high-column contribution are described in the neutral-gas inventory analysis.
For a fixed column density or rest-equivalent-width threshold, the number of ordinary Lyman-alpha forest features per unit redshift generally increases towards higher redshift. Over much of –, a rough description is with an index of order –, dependent on selection; the evolution is much slower at low redshift. Near reionization, blending and widespread opacity make a decomposition into individually detected lines increasingly inappropriate.
First separate physical evolution from geometrical path length. For comoving absorber density and proper interception area , absorber incidence and comoving number density givesEven a non-evolving population is not constant per unit redshift. Using absorption distance removes this particular geometrical effect.
The remaining redshift evolution of the Lyman-alpha forest reflects several competing processes. Cosmic expansion dilutes the gas; at fixed overdensity, photoionization equilibrium gives , so dilution can move many features below a fixed threshold. The cosmic ionizing background evolves as quasars, stellar sources and ionizing-photon absorption evolve; a decline of its intensity at late times partly offsets dilution. Photoheating changes temperature and radiative recombination, while gravitational instability redistributes gas into denser structures and hot shocked phases and changes its velocity field. Thus evolving line counts are not a direct count of conserved clouds; the density, thermal state, radiation field, geometry and observational selection must all be accounted for. The high-redshift increase and its physical interpretation are documented in the forest observations and models.
Near the background quasar, the quasar proximity effect typically reduces the number and strength of Lyman-alpha forest features relative to regions farther along the sightline. It is an ionization effect, not evidence that the quasar lies in an empty region. At fixed gas density and temperature, photoionization equilibrium givesIf the unperturbed neutral-hydrogen column-density distribution is , , detecting a column above now requires its unperturbed column to exceed . Integrating that distribution shows that the number above threshold is reduced by . This supplies an explicit model for the decline of line counts.
The known quasar luminosity estimates its photoionization rate at proper separation :These expressions assume unattenuated, steady, isotropic quasar emission and a specified ionizing spectrum. Fitting the measured suppression as a function of separation determines the ratio and hence constrains the cosmic ionizing background. A weaker background gives a larger region in which the quasar dominates. For fixed background spectral shape, this constrains its specific intensity near the Lyman limit system ionization edge, not an arbitrary spectral function. The proximity-effect estimator of the ionizing background is biased if the host gas is overdense, the quasar's past luminosity differs from its observed luminosity, its radiation is anisotropic, or systemic-redshift errors distort the inferred separation; absorption between source and gas also changes . These effects explain why the method needs environmental and source modeling, as discussed in the proximity-effect measurements.
Articles by others on the same topic
There are currently no matching articles.