In the SIR model, count susceptible, infectious, and recovered immune individuals. The closed population has . Under homogeneous mixing, use the paper's mass-action infection convention: each susceptible has infection hazard function , so the population infection rate is . Each infectious individual recovers with hazard function , giving population recovery rate and mean infectious duration .
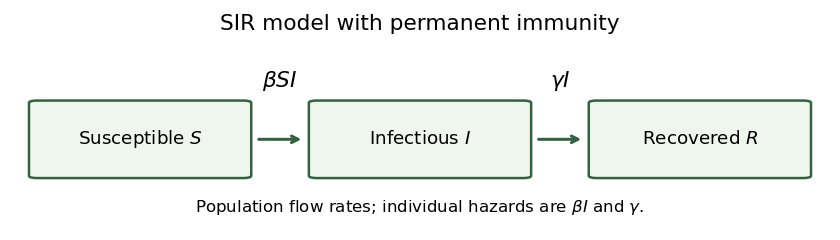

The arrows are one-way: recovered individuals are immune, and there are no demographic entries or exits. The transition intensities attached to the arrows are population flow rates, rather than individual hazard functions.
The deterministic SIR model follows the ordinary differential equationsUse and . The state space is , ; summing the three equations proves conservation of this population. Infection is supported only where and , and recovery only where . The rates vanish at the corresponding boundaries, preventing negative compartment sizes.
This convention has an unnormalized population infection rate , as required by the printed threshold. A convention with infection rate would use a differently scaled parameter.
Whenever , divide the first SIR model equation by the recovery equation:The SIR susceptible-recovered identity follows by integrating from , giving susceptibles as a function of recovered individuals:Population conservation then gives the infectious count:These identities extend continuously to the limiting state where the infectious count vanishes.
The infectious count in the SIR model obeys . At the initial state, , so initial epidemic growth requires the epidemic threshold for the closed SIR modelHere is the basic reproduction number in this mass-action infection convention. Necessity also follows globally: is nonincreasing, so if , then for all time and never increases. When , growth is impossible.
At time zero the chain-binomial epidemic model has and , independently. The update gives . Since and , extinction at day one is equivalent to and . Hence the one-day extinction probability isThis is the exact probability for the printed discrete-time approximation, which requires wherever used. It should not be substituted for the distinct continuous-time extinction calculation.
For the stochastic SIR model, the state is a continuous-time Markov chain on nonnegative integer triples summing to , initially . Its only transitions areRates vanish when a proposed transition would leave the state space. Equivalently, with independent unit-rate Poisson processes , the Poisson time-change representation of a Markov chain isThe left limits describe the state immediately before each jump. In the Gillespie algorithm, wait an exponential distribution time with rate , then choose infection or recovery in proportion to these two rates.
Initially, the infection and recovery transition intensities are and . By competing exponential clocks, the first-event waiting time has distribution
The first event causes extinction precisely when it is recovery of the sole initially infectious individual. An infection would instead give two infectious individuals. The competing exponential clocks calculation therefore gives the first-event extinction probability
Write . If the first event is recovery, the epidemic has ended and a second event is impossible. If the first event is infection at time , its density is , and the new state is . The total next-event rate isThus, by the Markov property, the two-event probability in a stochastic SIR model by time one isEvaluate the first term as . For the second, , soThereforeFor and , the denominator is positive. Event times are continuous, so inclusion or exclusion of the endpoint one makes no difference.
Articles by others on the same topic
There are currently no matching articles.