Let and be the real object and image distances from the thin lens. The object-screen separation gives , and the thin lens equation gives . Thus the two lens positions solveTheir separation is , soThis is the Bessel lens displacement method for measuring focal length. It uses the screen-object separation and the displacement between two sharp-image settings, reducing the need to locate the lens's effective optical center. It assumes the thin-lens or corresponding principal-plane approximation; is what provides two distinct real-image settings.
For thin lenses in contact, optical powers add. At the two reference wavelengths, the lensmaker's equation gives total powerAn achromatic lens has . Subtracting and solving for the curvature-factor ratio yieldsOpposite curvature-weighted powers compensate the two materials' optical dispersion.
At the intermediate reference wavelength, the lensmaker's equation gives . Therefore the curvature-factor ratio from the previous part impliesand henceThe last equality uses the Abbe number definition and expresses the achromatic doublet power balance in terms of component focal lengths.
Write and . The achromatic doublet power balance isSolving these two linear equations gives and . Taking reciprocals gives the required focal lengths:The design requires distinct Abbe numbers; identical relative dispersion cannot yield a nonzero total achromatic power from this two-element thin model.
is the Abbe number, a measure of inverse relative optical dispersion. Ordinary crown glasses have comparatively large and lower refractive index, while ordinary flint glasses have smaller and often higher index. The Abbe diagram below spans typical optical-glass values; the shaded family ranges are schematic, and the marked examples are catalogue data. Modern glass compositions broaden and overlap the simple crown/flint picture.
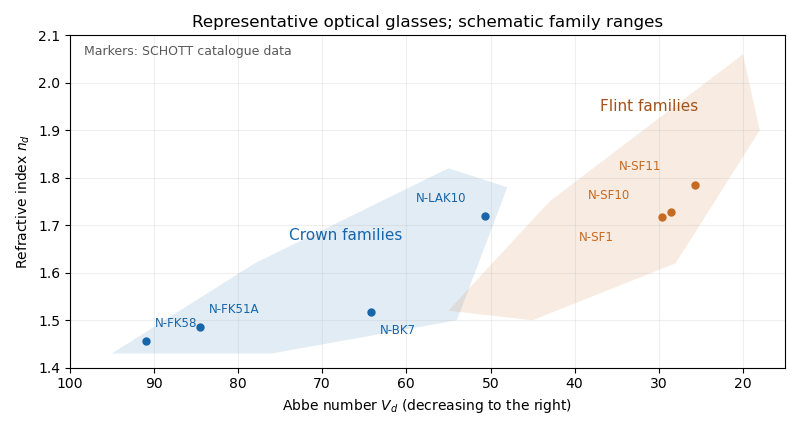

For a positive doublet with , the preceding formulas require and : a converging crown glass element and a diverging flint glass element. Their dispersion corrections cancel, while their net optical power is positive. A small difference in Abbe numbers requires large opposing component powers, which makes the design harder to correct for other optical aberrations.
Let the two internal angles be and , since the optical prism geometry gives . By Snell's law, the corresponding external angles are and , where . The deviation isOn the transmitted branch with and ,Thus is strictly increasing. The stationary condition forces , and the positive second derivative makes this the unique minimum deviation. ConsequentlyThe argument assumes a transmitted ray is possible; the symmetric internal angles must lie below the critical angle.
The reversibility of an optical ray interchanges entry and exit while preserving the total deviation. Away from the turning point, a ray and its reversed configuration give the same deviation with the entry and exit angles exchanged. At minimum deviation the two configurations merge: the path is symmetric and the entry and exit angles are equal.
Physically, distributing the refraction symmetrically between the two faces avoids making one face contribute disproportionately large bending. The strict convexity established in the preceding part proves that this stationary symmetric configuration is the minimum, rather than merely following from reversibility alone.
At minimum deviation, and . Substituting in Snell's law givesFor a known prism apex angle, measuring the minimum deviation with monochromatic light determines its refractive index. Repeating the measurement at several wavelengths measures optical dispersion. If the surrounding medium is not air, the measured ratio is relative to that medium's refractive index.
The two standard designs are multi-slit spectrographs and fiber-fed spectrographs. Both select many astronomical targets simultaneously and arrange their light so the resulting optical spectra remain distinguishable on the detector.
A multi-slit spectrograph uses a focal-plane mask containing slitlets at the target positions, or movable slitlets placed there. Each transmits its target and nearby sky into the collimator; a diffraction grating or other disperser produces a separate optical spectrum on the detector. The layout must avoid overlap between spectra, and the length of a slit allows local sampling of sky brightness and sometimes spatial information within the target.
A fiber-fed spectrograph places optical fibers at target positions in the telescope focal plane. The fibers carry the selected light to a spectrograph and their outputs are lined up as a pseudo-slit. The spectrograph can be mechanically stable and separate from the telescope's focal plane. Additional fibers aimed at blank sky provide a simultaneous estimate of sky brightness; fiber positioning, coupling losses, transmission, and focal-ratio degradation must be accounted for.
For field of view, fiber-fed spectrographs commonly cover wider sky areas: fibers can pick targets across a broad focal plane while feeding a compact spectrograph with a fixed output slit. A multi-slit spectrograph must image its field through the spectrograph optics, and spectra must fit on the detector without overlap, which restricts both field and target layout.
For spectral resolution, fibers can feed an optimized, stable high-dispersion instrument, including an echelle grating. The fiber image acts as its entrance width. In a multi-slit spectrograph, slit width and dispersion similarly determine the spectral resolving power. Neither feed type alone imposes a universal resolution ranking: narrower fibers or slits improve resolution at the cost of losing source light, and both can be designed for high or low resolution.
For faintness limit, slit masks often have an advantage for individual faint objects because they avoid fiber coupling and transmission losses, permit a slit width matched to astronomical seeing, and sample local sky along the slit. Fibers can admit more sky through a fixed circular aperture and require sky subtraction from separate locations; focal-ratio degradation can also reduce throughput. The actual limit depends on throughput, aperture size, background stability, and detector noise through the signal-to-noise ratio in photon counting. Well-designed fiber instruments can nevertheless be very efficient for wide-field surveys, so the comparison is conditional on the optical design and observing conditions.
Articles by others on the same topic
There are currently no matching articles.