Imagine an instrument measuring the same fixed quantity twice on each unit. Across units the persistent signal is a latent variable; the two measurement errors are fresh, mutually independent random variables, also independent of . Assume they have mean zero and common finite variance , while has mean and variance . ThenThus the Pearson correlation coefficient is when . Both measurements retain the same marginal mean and variance. Repetition does not make the entire population collapse toward ; it changes what we expect after selecting on .
For , further assuming normal distributions for and both measurement errors gives the conditional expectationSince , this predicted reading is closer to than is. Independence and zero mean errors alone do not justify this linear conditional expectation: without the normal distribution assumption the same expression is the linear least-squares projection, and the actual conditional expectation can be nonlinear. Correlated errors, a changing signal, or different error variances require their own model; a noisy reading by itself supplies no universal shrinkage factor.
Take the original synthetic model and , mutually independent random variables, with the second argument denoting variance. The pair has a multivariate normal distribution with mean zero, unit marginal variances, and Pearson correlation coefficient . Its conditional multivariate normal distribution isFor a first reading , the second reading has conditional expectation and conditional variance , hence standard deviation . There is still conditional probability of , a movement farther from zero, where is the standard normal distribution function. The line describes a conditional mean, not an individual trajectory.
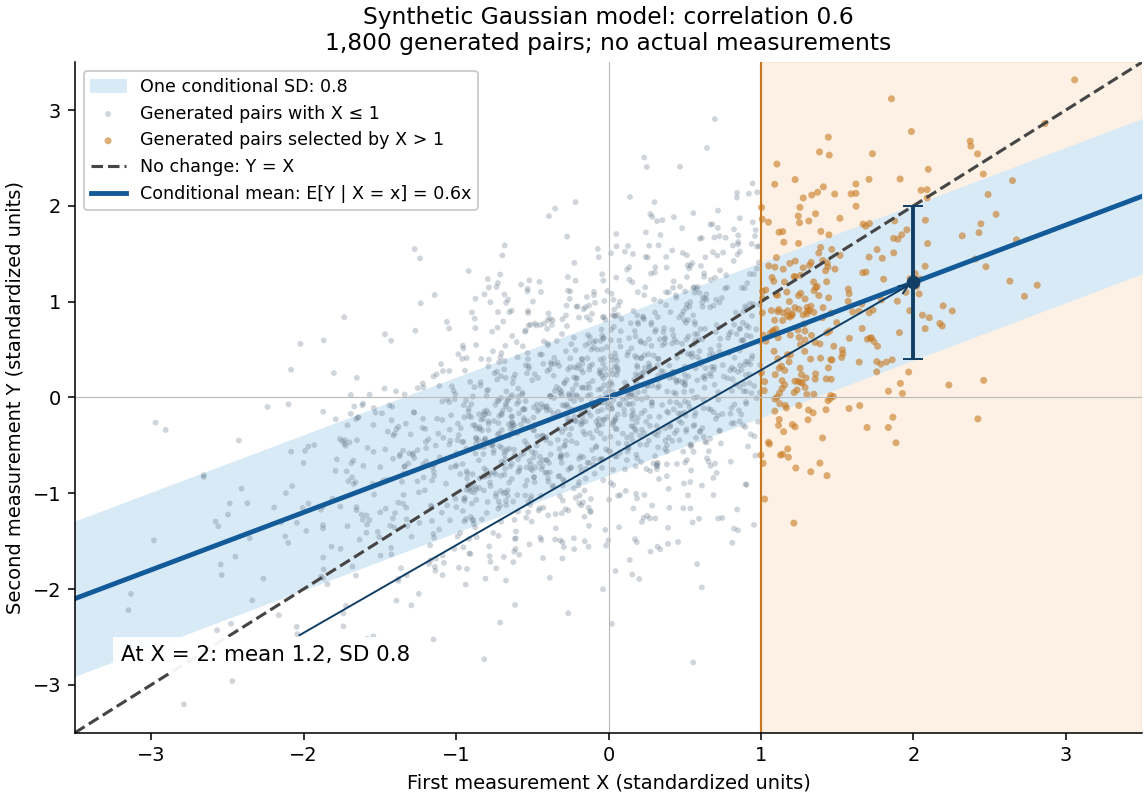

A short derivation isolates . Its covariance with is zero and its variance is . Because has a multivariate normal distribution, zero covariance implies independence: independently of . This also explains why reversing the two measurements gives . The statistical association does not identify a direction of causal effect.
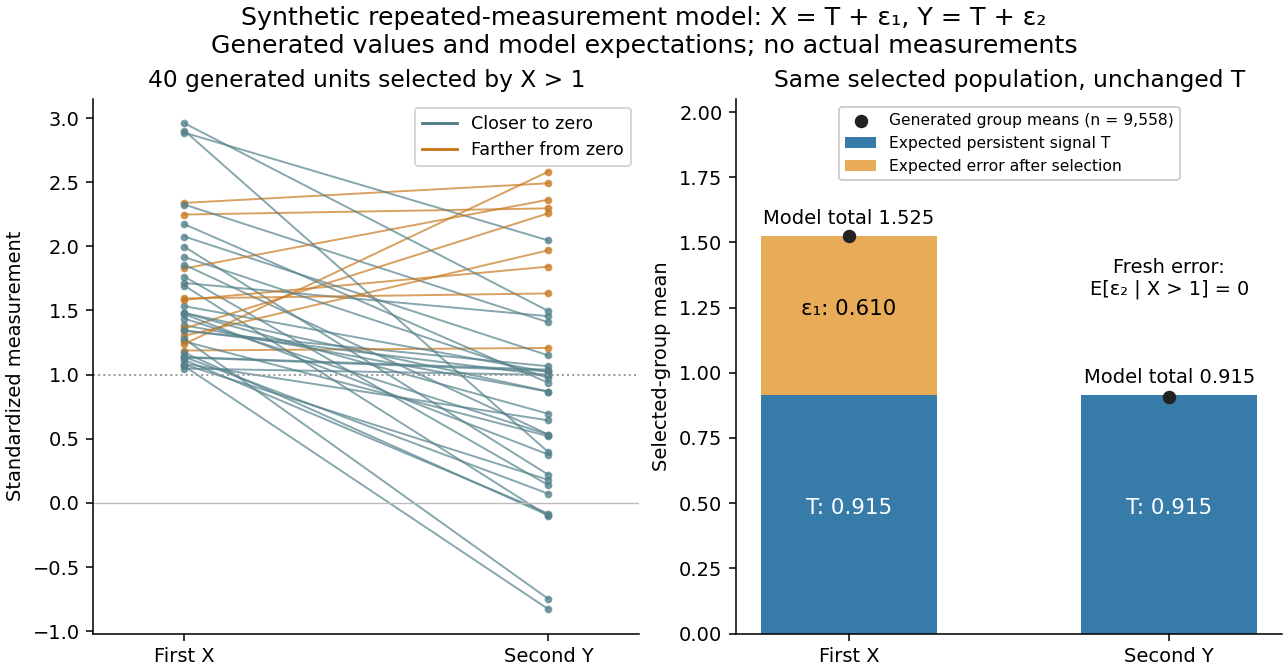
Select units with first reading , keep that membership fixed, and measure the same units again. The first reading now has a truncated normal distribution. For a general finite threshold , write for the standard normal density and for the standard normal distribution function. Since ,The tower property of conditional expectation lets us average the line over the selected group.[ref] At this givesThe average second reading is below the selection threshold even though every selected first reading exceeded it. This is a group expectation; any finite generated group's sample mean fluctuates around it. Selecting again on would define a different group and answer a different question.
The latent variable decomposition makes the apparent drop especially clear. Gaussian conditioning gives and . ThusThe first measurement error has zero unconditional mean, but positive selected mean. The second measurement error stays centered because it is independent of selection on . The persistent signal never changed.

Articles by others on the same topic
There are currently no matching articles.