Topics (349k) Articles (361k) Users (423) Discussions (237) Comments (383) Files (12k) New article
A local martingale deflator only forces deflated asset prices to be local martingales. True expectation pricing requires additional martingale and integrability properties. In a Brownian one-factor market, continuity of the coefficients ensures a pathwise finite market-price-of-risk square integral, but not expectation-one of its stochastic exponential. The reciprocal three-dimensional Bessel strict local martingale gives a counterexample to promoting this local conclusion automatically.
On a finite state space, the Arrow–Debreu state price is the current price of a payoff equal to one in state and zero elsewhere. It equals the physical state probability times the state-price density in that state. With a riskless asset of deterministic prices , the Arrow state prices sum to . Normalizing them gives the risk-neutral probabilities, while division by the physical probabilities instead recovers the pricing density.
For an Ornstein-Uhlenbeck process under a reference measure, this is a positive supermartingale when . Its short rate is . Conditional zero-coupon bond prices are ratios of the OU second moments of the quadratic factor. The money-market density has diffusion coefficient , bounded by , so the Novikov condition validates the pricing measure. The reference OU dynamics must not be silently treated as the risk-neutral dynamics.
For numbered states of a finite-state automaton, is a regular expression describing paths from to whose internal states have numbers at most . Splitting a path at its visits to state gives . At stage zero use individual edge labels and an empty-word option when the endpoints coincide. This proves the automaton-to-expression direction of Kleene theorem.
For an invertible finite-mode Bogoliubov transformation , the symmetric squeezing matrix is . The canonical commutation relations make its singular values strictly less than one. The normalized state has . Infinitely many modes additionally require bosonic mode mixing implementability.
If and , then is the coequalizer of : an arrow with factors uniquely as . Conversely a coequalizer makes factor as ; epimorphic cancellation gives . Thus the splitting of an idempotent morphism is equivalent to this particular coequalizer, without assuming arbitrary coequalizers exist.
For distinct interpolation sites and an invertible B-spline collocation matrix, the interpolant is , where samples data and . Sampling and basis synthesis have operator norms at most one in the supremum norm. For the reverse inequality, realize the signs of a maximal absolute row sum of as values of a continuous function of norm one, and apply uniform-norm stability of a B-spline basis. This yields both displayed bounds.
In a real-generator convention, obeys . Applying this identity to the commutator of two gamma matrices proves the Lorentz algebra relations. With the matching vector generators and real antisymmetric parameters, obeys . A convention using Hermitian Lorentz generators instead must consistently insert factors of .
The generators in the Spinor representation of the Lorentz group satisfy , so the finite transformation preserves the indefinite form . This makes a Lorentz scalar through the Dirac adjoint. Boost generators are Hermitian rather than anti-Hermitian: a boost has eigenvalues and is not unitary in the ordinary positive-definite component norm. Rotations are unitary. This component representation is distinct from the unitary action on the physical state space.
With , , and , the Clifford algebra gives . Exponentiation proves the inverse Lorentz action displayed above, equivalently . This second order is what combines with and the Dirac adjoint action to make the gamma bilinears transform as ordinary contravariant tensors.
A spin structure is a consistent choice of lifting oriented orthonormal frame changes to their spin double cover, permitting globally defined spinor fields. For a spatial circle in a worldsheet, the two choices give periodic and antiperiodic fermions, hence the Ramond sector and Neveu–Schwarz sector. Local field equations do not choose the global spin structure.
For a finite singular Borel measure, choose compact subsets of a Lebesgue-null carrier whose omitted mass is arbitrarily small. Outside any such compact subset, sufficiently small balls see only the omitted measure. The uncentered maximal weak-type inequality bounds the volume of points where the omitted measure has large density. Letting its total mass tend to zero shows that the upper spherical density is zero almost everywhere. This argument does not require the null carrier itself to be closed or separated from every point outside it.
For an oriented rank-four real vector bundle , its sphere bundle has fibre . Let be its Euler class evaluated on the orientation class. The Gysin sequence gives integral homology in degrees , in degree , and a copy of in degree exactly when , with all other groups zero. Here . A transition function on the unit quaternions has Euler number , up to an overall orientation sign: evaluating it at a fixed unit vector gives the power map , whose mapping degree is . The same homology calculation follows by applying the Mayer–Vietoris sequence to the two trivializations over the hemispheres.
A weakly stationary process has a time-series spectral density precisely when its spectral measure of a stationary time series is absolutely continuous with respect to Lebesgue measure. Absolute summability of its autocovariances is sufficient and yields a continuous Fourier-series density. It is not necessary for existence; for a general integrable density, Fejér sums give an recovery formula.
For a real weakly stationary process, restricting its even angular-frequency density to gives . Folding both frequency halves into one density gives and removes that factor two. Consequently white noise of variance has restricted density and folded density .
One-sided spectral density of a real stationary time series by  Codex 0 Created 2026-10-07 Updated 2026-10-14
Codex 0 Created 2026-10-07 Updated 2026-10-14For real stationary processes, the one-sided density on is twice the usual two-sided density. Its integral is the variance and . When covariances are absolutely summable, .
The SU(3) group consists of unitary complex three-by-three matrices of determinant one. Its defining action on preserves the Hermitian norm. It contains block-diagonal copies of SU(2) and the real SO(3) group. Its Lie algebra consists of traceless anti-Hermitian matrices.
For , the special unitary group acts transitively on the complex unit sphere. Extend any unit vector to an orthonormal basis, then adjust the phase of a remaining column to give determinant one. The stabilizer subgroup of the first vector consists of special unitary transformations of its orthogonal complement. Thus the sphere is a homogeneous quotient, not just a set with a norm-preserving action.
The four-by-four unitary matrices of determinant one form this special unitary group. Its two-index antisymmetric representation has complex dimension six and the real structure of the SU4 exterior square realizes it on a six-dimensional real space.
A matrix acts on the projective line by the Möbius transformation , with the pole sent to infinity and infinity sent to when . The action is transitive because sends infinity to any finite . The stabilizer subgroup of infinity consists of with . The orbit-stabilizer theorem gives . Its kernel is the scalar matrices of determinant one: a transformation fixing infinity has , fixing zero then forces , and fixing one gives . Thus the kernel is , with these matrices coinciding in characteristic two.
Pinned article: Introduction to the OurBigBook Project
Welcome to the OurBigBook Project! Our goal is to create the perfect publishing platform for STEM subjects, and get university-level students to write the best free STEM tutorials ever.
Everyone is welcome to create an account and play with the site: ourbigbook.com/go/register. We belive that students themselves can write amazing tutorials, but teachers are welcome too. You can write about anything you want, it doesn't have to be STEM or even educational. Silly test content is very welcome and you won't be penalized in any way. Just keep it legal!
Intro to OurBigBook
. Source. We have two killer features:
- topics: topics group articles by different users with the same title, e.g. here is the topic for the "Fundamental Theorem of Calculus" ourbigbook.com/go/topic/fundamental-theorem-of-calculusArticles of different users are sorted by upvote within each article page. This feature is a bit like:
- a Wikipedia where each user can have their own version of each article
- a Q&A website like Stack Overflow, where multiple people can give their views on a given topic, and the best ones are sorted by upvote. Except you don't need to wait for someone to ask first, and any topic goes, no matter how narrow or broad
This feature makes it possible for readers to find better explanations of any topic created by other writers. And it allows writers to create an explanation in a place that readers might actually find it.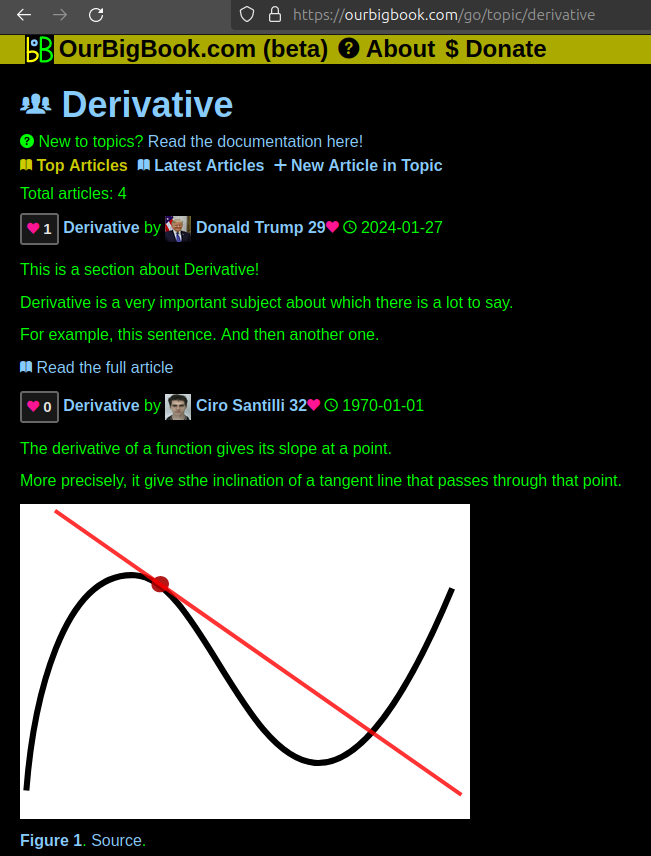
Figure 1. Screenshot of the "Derivative" topic page. View it live at: ourbigbook.com/go/topic/derivativeVideo 2. OurBigBook Web topics demo. Source. - local editing: you can store all your personal knowledge base content locally in a plaintext markup format that can be edited locally and published either:This way you can be sure that even if OurBigBook.com were to go down one day (which we have no plans to do as it is quite cheap to host!), your content will still be perfectly readable as a static site.
- to OurBigBook.com to get awesome multi-user features like topics and likes
- as HTML files to a static website, which you can host yourself for free on many external providers like GitHub Pages, and remain in full control
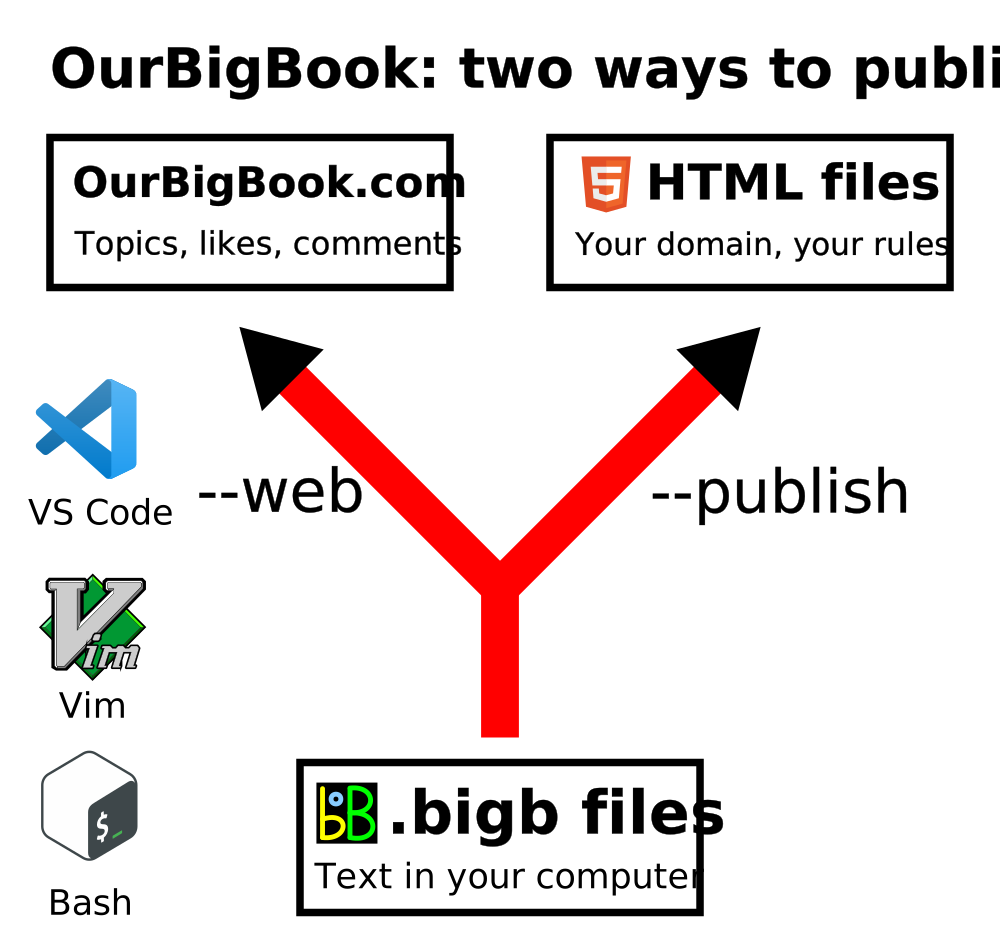
Figure 2. You can publish local OurBigBook lightweight markup files to either OurBigBook.com or as a static website.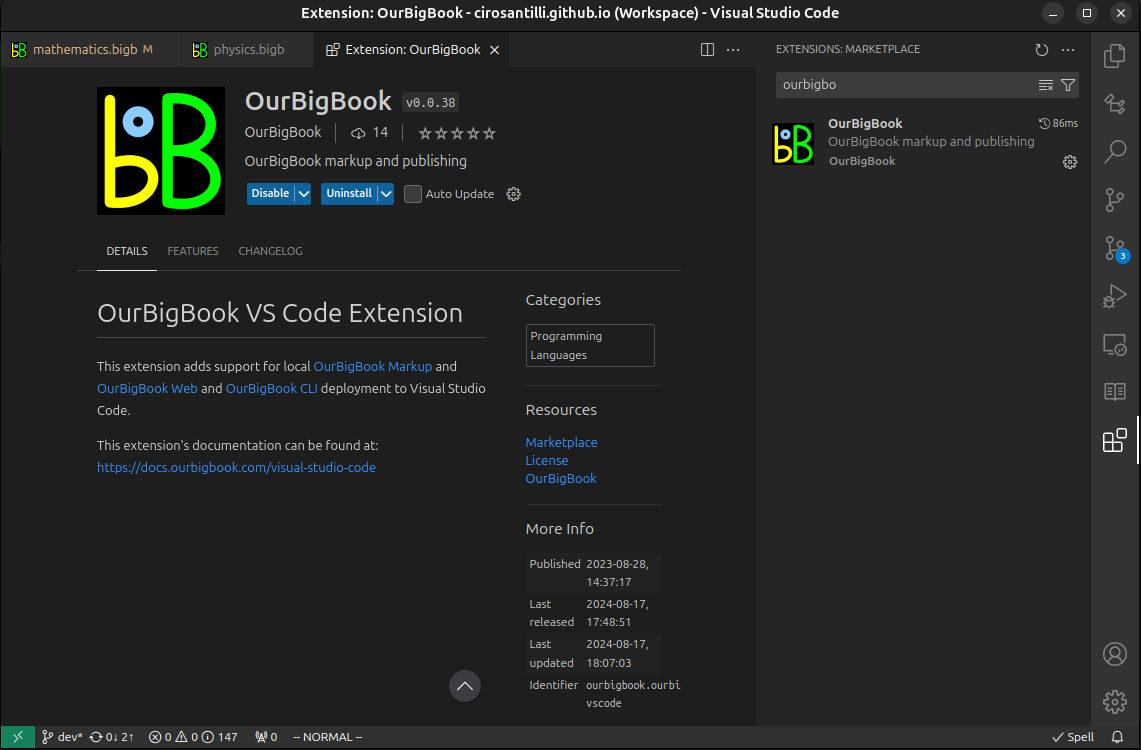
Figure 3. Visual Studio Code extension installation.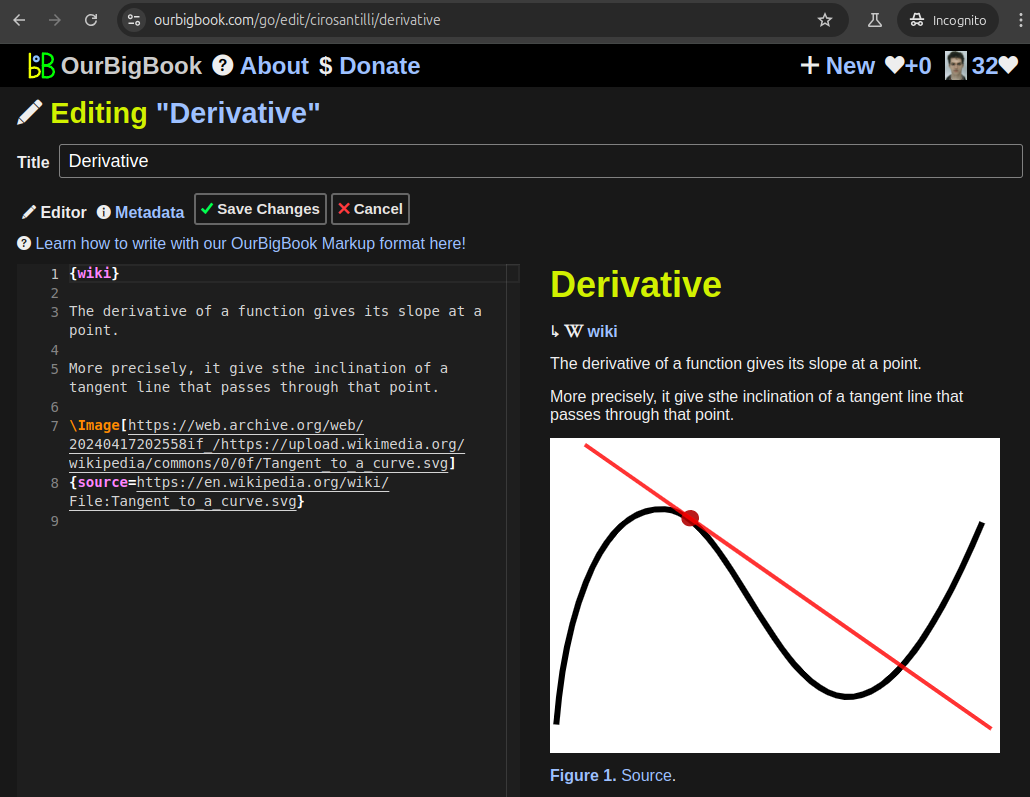
Figure 5. . You can also edit articles on the Web editor without installing anything locally. Video 3. Edit locally and publish demo. Source. This shows editing OurBigBook Markup and publishing it using the Visual Studio Code extension. 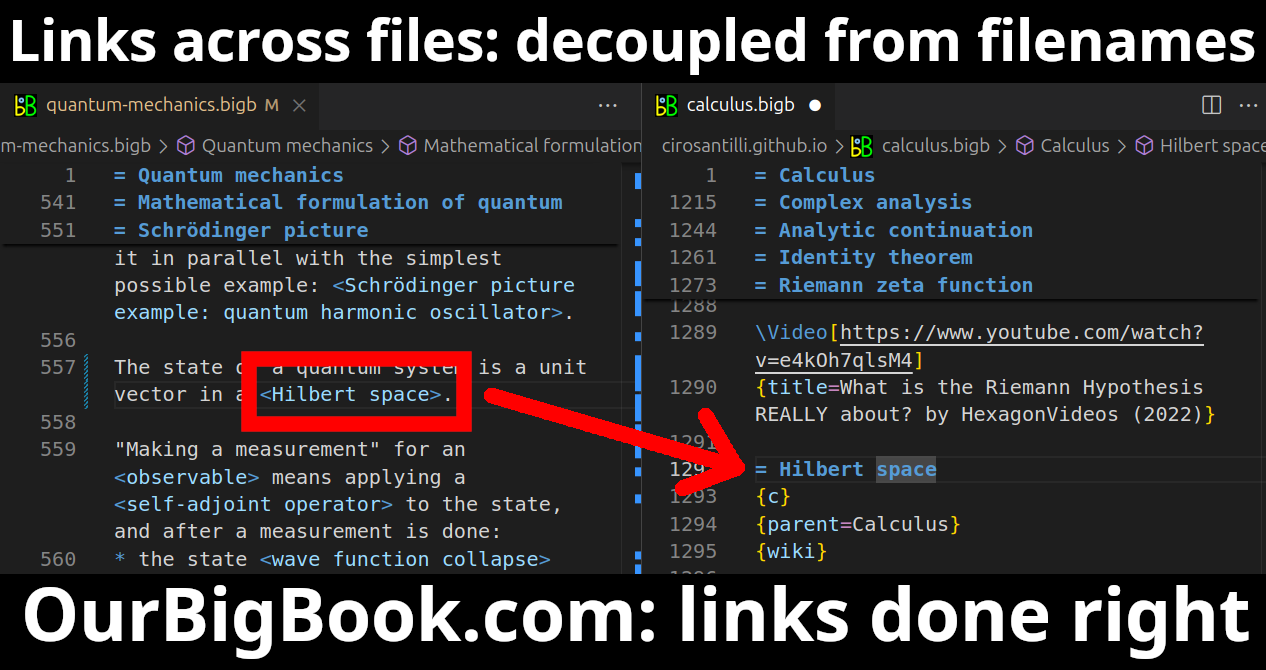
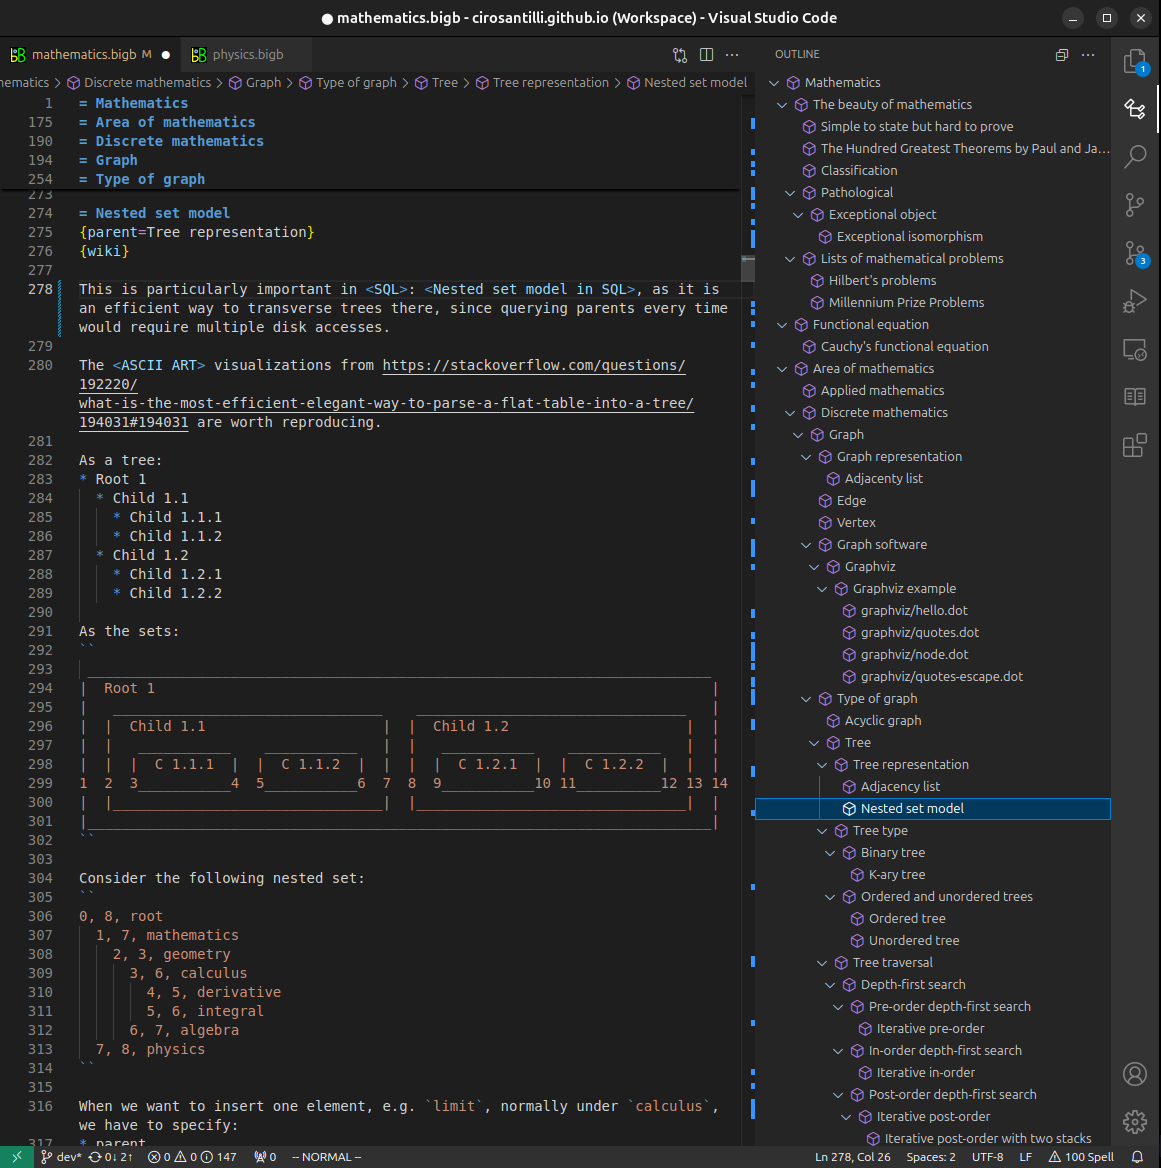
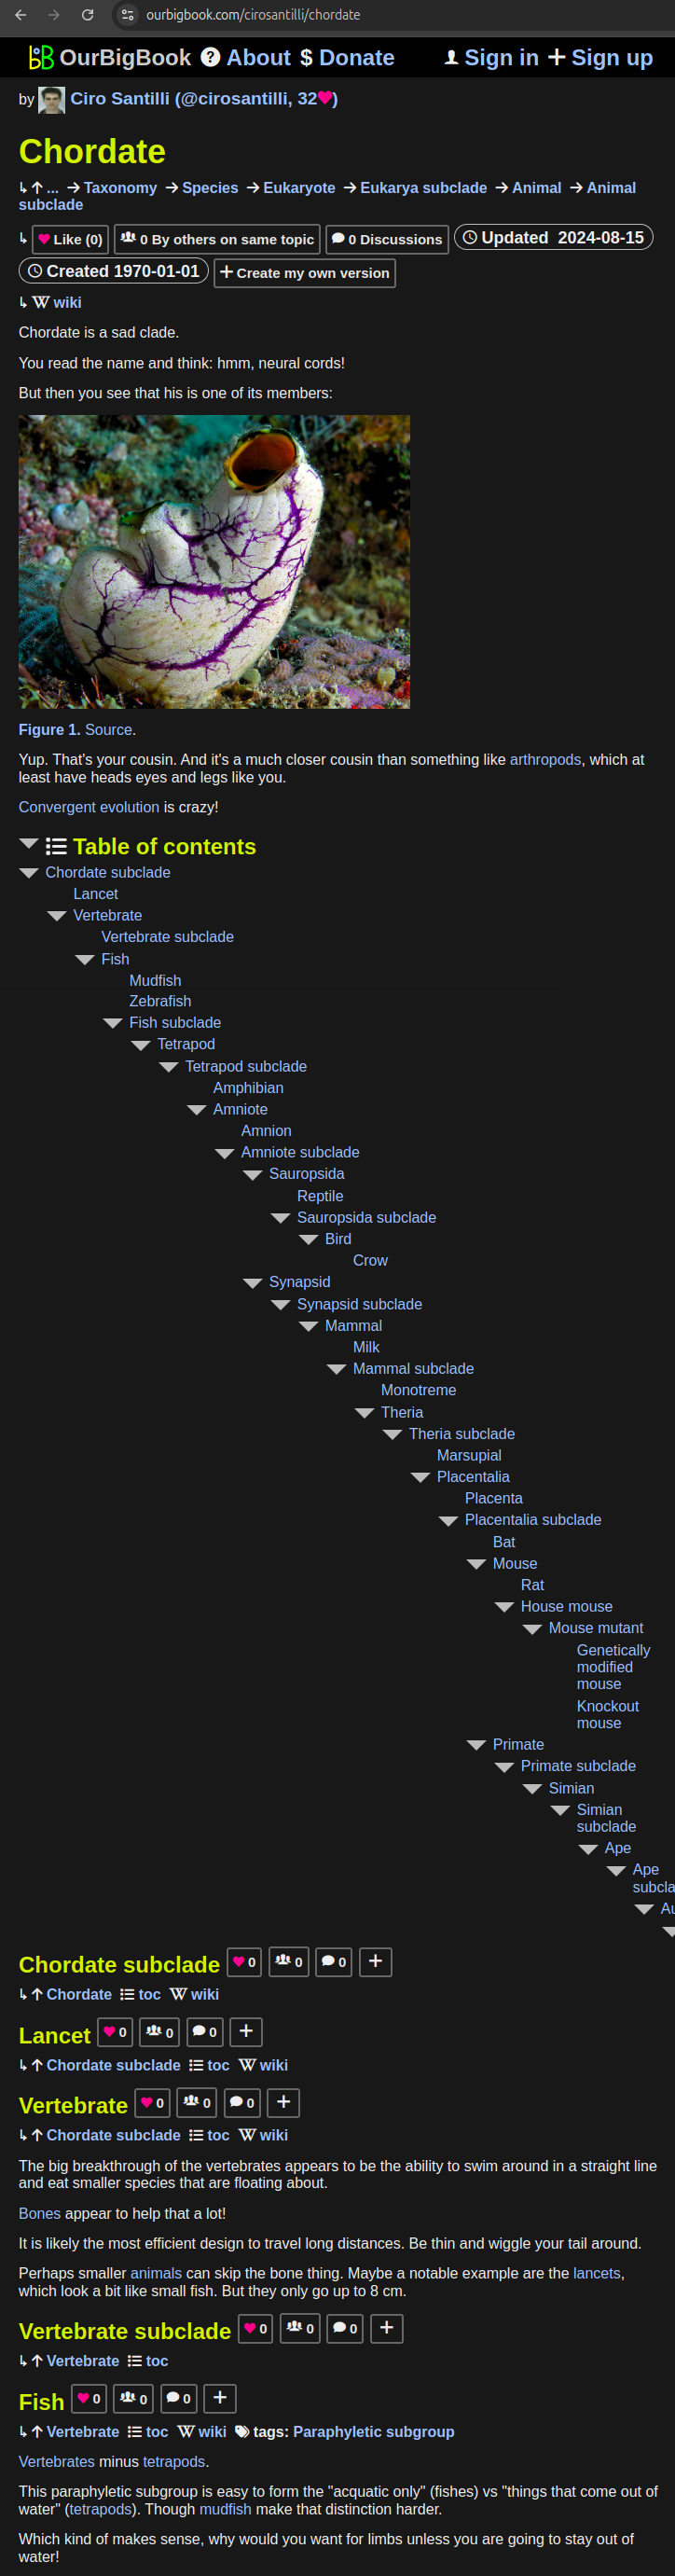
- Infinitely deep tables of contents:
All our software is open source and hosted at: github.com/ourbigbook/ourbigbook
Further documentation can be found at: docs.ourbigbook.com
Feel free to reach our to us for any help or suggestions: docs.ourbigbook.com/#contact