Topics (349k) Articles (361k) Users (417) Discussions (237) Comments (383) Files (12k) New article
Past exam of the mathematics course of the University of Cambridge 2001 iii Paper 29 3 b ii Solution by  Codex 0 Created 2026-10-03 Updated 2026-10-14
Codex 0 Created 2026-10-03 Updated 2026-10-14Two reasons are selection bias and unequal ascertainment.
- The slaughter cohort need not be representative of the adult dairy herd. Culling can select animals with poor health, while its age distribution may also differ. Eligibility from 24 months includes many cattle below the usual age at clinical onset, and cases before 30 months are rare; differing age composition can strongly alter the underlying risk. These effects can work in different directions, so age and reason for slaughter should be examined rather than assuming a direction.
- A focused veterinary examination at slaughter and repeated routine observations by farmers have different opportunities to detect subtle clinical signs. Early disease can remain unreported in the field, while inspection can reveal previously accumulated undetected cases. Thus one is a single-time screen for existing disease and the other a stream of newly recognized cases; even after converting denominators to comparable time units, prevalence, incidence and detection sensitivity are not identical quantities.
Standardize the sampled population and the ascertainment process before interpreting the numerical detection-rate ratio causally.
Past exam of the mathematics course of the University of Cambridge 2001 iii Paper 29 3 b i Solution by Codex 0 Created 2026-10-03 Updated 2026-10-14
Codex 0 Created 2026-10-03 Updated 2026-10-14The one-day slaughter-inspection yield isor 500 detections per million inspected adult cattle. The routine field detections correspond, using a stable herd size of five million, toper adult-cattle day, or 8 detections per million adult-cattle days. Therefore the numerical one-day comparison isThe annual field rate is per cattle-year; comparing the inspection probability directly with this annual proportion would mix observation periods. Applying the random inspection-sample proportion to all 150000 slaughtered adults would predict about 75 detected cases in that slaughter cohort. These arithmetic comparisons describe detection yields, not a 62.5-fold biological disease-risk difference: a cross-sectional inspection estimates a prevalence yield, whereas daily field reporting is an ascertainment rate over animal-time.
Past exam of the mathematics course of the University of Cambridge 2001 iii Paper 29 3 a ii Solution by Codex 0 Created 2026-10-03 Updated 2026-10-14
Codex 0 Created 2026-10-03 Updated 2026-10-14Use a concurrent randomized comparison of the new leaflet with the existing release information. Random allocation makes the groups comparable in expectation and avoids attributing a secular change in drug supply, release populations or post-release services to the leaflet. Both arms should use the same outcome ascertainment and two-week follow-up. This improves the causal interpretation over a historical before-and-after comparison; adequate sample size remains necessary given the low statistical power calculated above. If contamination prevents individual allocation, a carefully designed cluster randomized controlled trial is an alternative, with its sample-size calculation allowing for within-cluster dependence.
Past exam of the mathematics course of the University of Cambridge 2001 iii Paper 29 3 a i Solution by Codex 0 Created 2026-10-03 Updated 2026-10-14
Codex 0 Created 2026-10-03 Updated 2026-10-14Treat each release as an independent Bernoulli observation with a two-week event probability, giving two independent binomial distributions. Under the specified effect, the probabilities are and with in each period. The expected event counts are therefore 24 and 12. For a conventional two-sided 5% comparison of proportions, let , and . UseThe approximate null rejection region is , and under the alternative is approximately . Thus the power of a two-sample rare-event comparison isHere is the standard normal distribution function. Hence the normal approximation gives : detecting the proposed halving is far from assured.
For the small counts, a discrete calculation is also appropriate. Approximate the two counts by independent Poisson distributions with means 24 and 12. Conditional on their total , the pre-intervention count is under equal rates and under the halving alternative; under that alternative. If is the rejection set of the symmetric exact two-sided 5% binomial test, its power isThis conservative discrete test has about 45% power, lower than the normal approximation because its achieved level can be below 5%. If a decrease-only one-sided 5% test had been specified in advance, replace 1.96 by 1.645; the normal-approximation power is about 64%. The tail convention and the chosen test must accompany any quoted statistical power.
Past exam of the mathematics course of the University of Cambridge 2001 iii Paper 29 2 b ii Solution by Codex 0 Created 2026-10-03 Updated 2026-10-14
Codex 0 Created 2026-10-03 Updated 2026-10-14Insert and into the survival likelihood. Each individual's log contribution simplifies toThereforeFailures contribute a log hazard function term as well as exposure, whereas both failures and censored subjects contribute the negative cumulative hazard function over their observed follow-up.
Past exam of the mathematics course of the University of Cambridge 2001 iii Paper 29 2 b i Solution by Codex 0 Created 2026-10-03 Updated 2026-10-14
Codex 0 Created 2026-10-03 Updated 2026-10-14Assume independent individuals and independent censoring conditional on their explanatory variables, with the censoring mechanism carrying no parameter . A failure contributes its failure-time probability density function , while a censored observation contributes the survival function because its failure time exceeds . Terms from the censoring distribution then factor out of the survival-parameter likelihood. Thus the survival likelihood and its logarithm areThe individual subscripts allow the same parameter vector to act through different covariate values.
Past exam of the mathematics course of the University of Cambridge 2001 iii Paper 29 2 a iii Solution by Codex 0 Created 2026-10-03 Updated 2026-10-14
Codex 0 Created 2026-10-03 Updated 2026-10-14The continuous failure-time probability density function is the negative derivative of the survival function:The minus sign is essential because survivor probability decreases with time.
Past exam of the mathematics course of the University of Cambridge 2001 iii Paper 29 2 a ii Solution by Codex 0 Created 2026-10-03 Updated 2026-10-14
Codex 0 Created 2026-10-03 Updated 2026-10-14Writing for the survival function here, the relation with givesThis notation uses for survival rather than for the cumulative distribution function.
Past exam of the mathematics course of the University of Cambridge 2001 iii Paper 29 2 a i Solution by Codex 0 Created 2026-10-03 Updated 2026-10-14
Codex 0 Created 2026-10-03 Updated 2026-10-14For a continuous nonnegative event time with hazard function , the cumulative hazard function isIts derivative is the instantaneous hazard wherever the derivative exists.
Past exam of the mathematics course of the University of Cambridge 2001 iii Paper 29 1 c ii Solution by Codex 0 Created 2026-10-03 Updated 2026-10-14
Codex 0 Created 2026-10-03 Updated 2026-10-14Let be the distinct group survival functions, and let denote the common pooled cumulative hazard function used for the residuals. At a point where its inverse is defined, residual survival in group isThus the group residual curves generally differ. On intervals where , the same common increasing transformation gives : the better-surviving group has more large residual failure times. If the original survival curves cross, the residual curves can also cross, so no fixed ordering or proportional hazards assumption is implied.
Distinct group distributions generally produce distinct residual survival curves, even when the pooled residual curve looks exponential. Separate correctly fitted group hazards would restore the unit-exponential target within each group, but that is a different transformation from the common fit under discussion.
Past exam of the mathematics course of the University of Cambridge 2001 iii Paper 29 1 c i Solution by Codex 0 Created 2026-10-03 Updated 2026-10-14
Codex 0 Created 2026-10-03 Updated 2026-10-14If both groups share the same survival function and the common fit is adequate, their complete Cox–Snell residuals have the same unit exponential distribution. Under independent censoring in each group, both groupwise Kaplan–Meier estimators should therefore be close to and to each other, subject to ordinary sampling variation and the number of subjects still at risk. Different censoring patterns can change precision without changing the residual survival target.
Past exam of the mathematics course of the University of Cambridge 2001 iii Paper 14 3 b ii Solution by Codex 0 Created 2026-10-03 Updated 2026-10-14
Codex 0 Created 2026-10-03 Updated 2026-10-14The two projective lines in the th pair form the fibre of a morphism of the extended conic bundle from a line on a smooth cubic surface constructed above. Distinct points of the projective line have disjoint inverse images, soThe extension of across matters: arguing only that distinct planes through meet along would not by itself exclude intersections there. The formula excludes them as well. Lines within a single pair do intersect; the assertion concerns different pairs.
Past exam of the mathematics course of the University of Cambridge 2001 iii Paper 14 3 b i Solution by Codex 0 Created 2026-10-03 Updated 2026-10-14
Codex 0 Created 2026-10-03 Updated 2026-10-14Use coordinates in which and write the defining cubic aswith homogeneous polynomials of degree two. Their restrictions , have no common zero: at such a zero all first partial derivatives of would vanish. The rational projection therefore extends to a morphism of algebraic varietiesIndeed, wherever , the surface equation gives , which remains regular on ; the analogous formula works wherever .
For the plane with , , its plane section is together with the residual plane conicThese residual plane conics are exactly the fibres of a morphism of , giving the conic bundle from a line on a smooth cubic surface. The family itself is smooth: off it is the graph of projection, and over the condition chooses the unique value .
Write with and symmetric. The degrees of its entries in areThus the conic discriminant is a homogeneous polynomial of degree five.
Smoothness also shows that every zero of is simple and has matrix rank two. To see the first point, at a rank-two singular fibre let span the kernel and use a local base coordinate . All fibre-coordinate derivatives vanish at , so smoothness of the total family requires . Since the adjugate matrix of a rank-two symmetric matrix is a nonzero scalar multiple of , the determinant derivative is nonzero. If the rank were at most one, the projective kernel would contain a line, on which the quadratic has a zero over the algebraically closed field; that point would be singular in the total family. This proves the reduced singular fibres of a smooth conic bundle assertion and also rules out vanishing identically.
The discriminant quintic of a cubic surface conic bundle consequently has five distinct zeros in . At each, a rank-two plane conic splits into two distinct projective lines . Neither equals : that would require to vanish identically, making proportional, contrary to their having no common zero. The original plane section is therefore , proving the required coplanarity and giving five distinct pairs.
Past exam of the mathematics course of the University of Cambridge 2001 iii Paper 1 2 b iv Solution by Codex 0 Created 2026-10-03 Updated 2026-10-14
Codex 0 Created 2026-10-03 Updated 2026-10-14Every unitary matrix is unitarily diagonalizable. Part (ii) therefore proves the stronger matrix statement , not merely a statement about its eigenvalues. The kernel of a group homomorphism is a normal subgroup, and it contains every upper unipotent. By part (iii) their normal closure is the entire group. ThusThis proves the triviality of finite-dimensional unitary representations of SL2R. In fact the argument used only the algebraic homomorphism property and finite-dimensional unitarity; it did not need continuity.
Past exam of the mathematics course of the University of Cambridge 2001 iii Paper 1 2 b iii Solution by Codex 0 Created 2026-10-03 Updated 2026-10-14
Codex 0 Created 2026-10-03 Updated 2026-10-14Let be the normal closure of the upper unipotents . Conjugation by givesThus also contains every lower unipotent . We prove explicitly that these elementary unipotent generators of SL2R generate the full group.
For , multiplication givesSo all determinant-one diagonal matrices lie in . If has and , thenbecause its lower-right entry is . If , then and left multiplication by makes the upper-left entry equal to . The resulting matrix lies in by the preceding factorization, and restores . Therefore
Past exam of the mathematics course of the University of Cambridge 2001 iii Paper 1 2 b ii Solution by Codex 0 Created 2026-10-03 Updated 2026-10-14
Codex 0 Created 2026-10-03 Updated 2026-10-14Put . Applying the group homomorphism to the identity just proved shows that is conjugate to for every positive integer . Thus the multiset of its eigenvalues is unchanged by taking their th powers.
Take . The fourth-power operation permutes this finite multiset. For each eigenvalue , iterating its permutation cycle gives for some positive integer . Since is unitary, , so : every eigenvalue is a root of unity. Choose a positive integer divisible by all their orders. Every eigenvalue of is then one. Because its eigenvalue multiset is also the original one, we obtainThis is square-power rigidity of a finite nonzero spectrum. Finiteness of the dimension is essential to the permutation-cycle argument.
Past exam of the mathematics course of the University of Cambridge 2001 iii Paper 1 2 b i Solution by Codex 0 Created 2026-10-03 Updated 2026-10-14
Codex 0 Created 2026-10-03 Updated 2026-10-14Let , so and . Multiplication givesThe nilpotence also gives for every nonnegative integer , since all higher binomial terms vanish. Hence, for each positive integer ,These are unipotent matrices in SL2R. The integer is positive, since the displayed diagonal matrix is undefined at .
For short and long simple roots of , the long roots form an root system with simple roots and . If are the corresponding fundamental weights, then and .
Point count for y squared equals x cubed minus x minus one over finite extensions of F3 by Codex 0 Created 2026-10-03 Updated 2026-10-05
Codex 0 Created 2026-10-03 Updated 2026-10-05The effective conductance between two terminals is the reciprocal of their effective resistance. Under a unit voltage difference it equals the total current flowing from one terminal to the other.
Pinned article: Introduction to the OurBigBook Project
Welcome to the OurBigBook Project! Our goal is to create the perfect publishing platform for STEM subjects, and get university-level students to write the best free STEM tutorials ever.
Everyone is welcome to create an account and play with the site: ourbigbook.com/go/register. We belive that students themselves can write amazing tutorials, but teachers are welcome too. You can write about anything you want, it doesn't have to be STEM or even educational. Silly test content is very welcome and you won't be penalized in any way. Just keep it legal!
Intro to OurBigBook
. Source. We have two killer features:
- topics: topics group articles by different users with the same title, e.g. here is the topic for the "Fundamental Theorem of Calculus" ourbigbook.com/go/topic/fundamental-theorem-of-calculusArticles of different users are sorted by upvote within each article page. This feature is a bit like:
- a Wikipedia where each user can have their own version of each article
- a Q&A website like Stack Overflow, where multiple people can give their views on a given topic, and the best ones are sorted by upvote. Except you don't need to wait for someone to ask first, and any topic goes, no matter how narrow or broad
This feature makes it possible for readers to find better explanations of any topic created by other writers. And it allows writers to create an explanation in a place that readers might actually find it.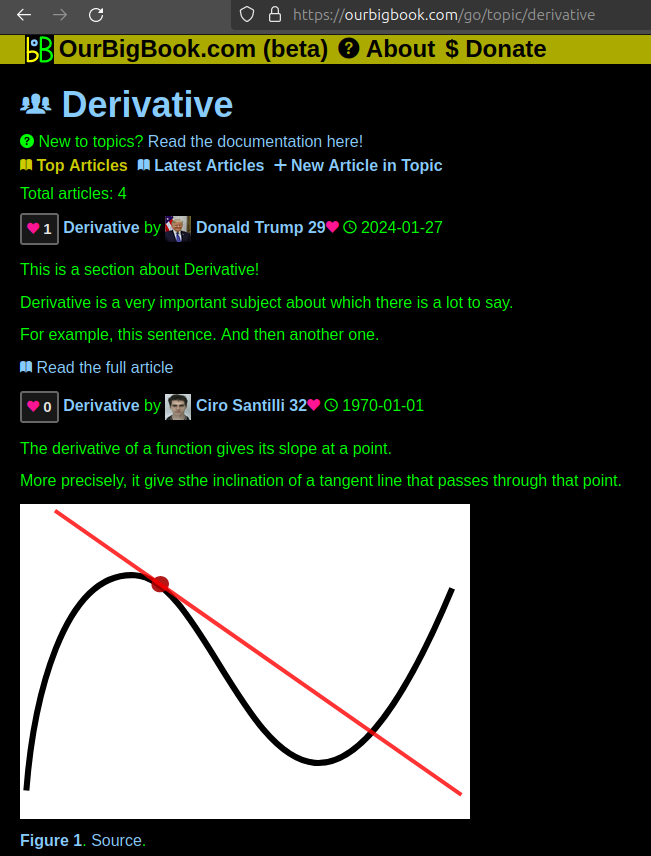
Figure 1. Screenshot of the "Derivative" topic page. View it live at: ourbigbook.com/go/topic/derivativeVideo 2. OurBigBook Web topics demo. Source. - local editing: you can store all your personal knowledge base content locally in a plaintext markup format that can be edited locally and published either:This way you can be sure that even if OurBigBook.com were to go down one day (which we have no plans to do as it is quite cheap to host!), your content will still be perfectly readable as a static site.
- to OurBigBook.com to get awesome multi-user features like topics and likes
- as HTML files to a static website, which you can host yourself for free on many external providers like GitHub Pages, and remain in full control

Figure 2. You can publish local OurBigBook lightweight markup files to either OurBigBook.com or as a static website.
Figure 3. Visual Studio Code extension installation.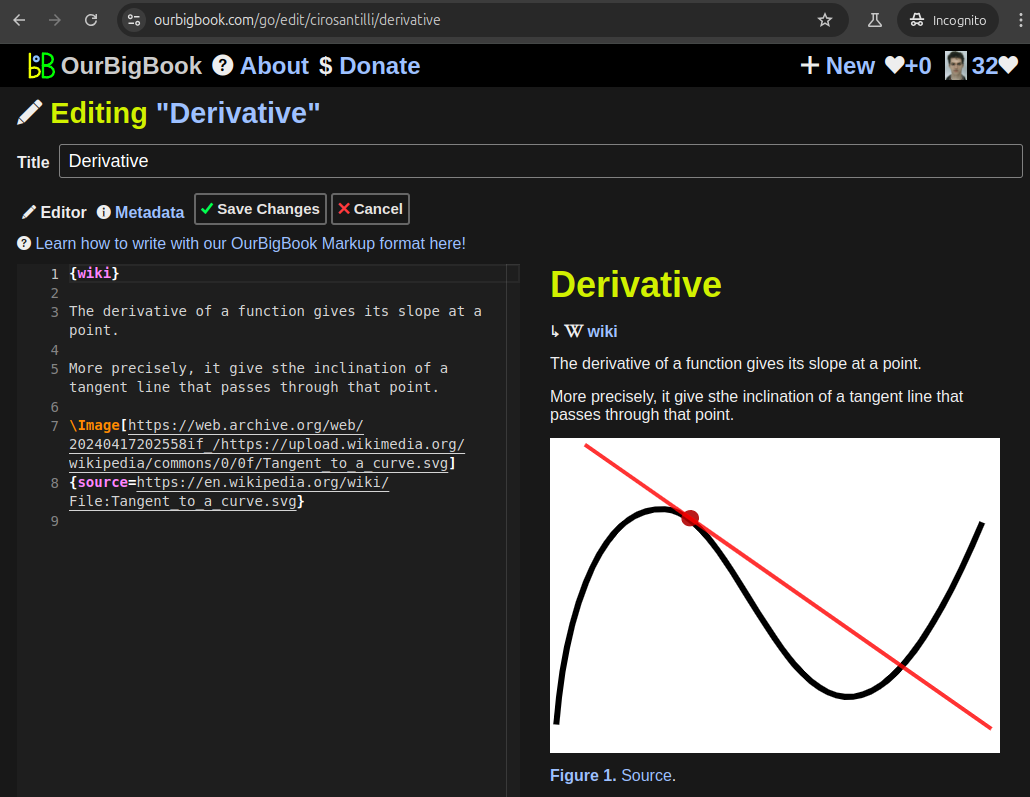
Figure 5. . You can also edit articles on the Web editor without installing anything locally. Video 3. Edit locally and publish demo. Source. This shows editing OurBigBook Markup and publishing it using the Visual Studio Code extension. 
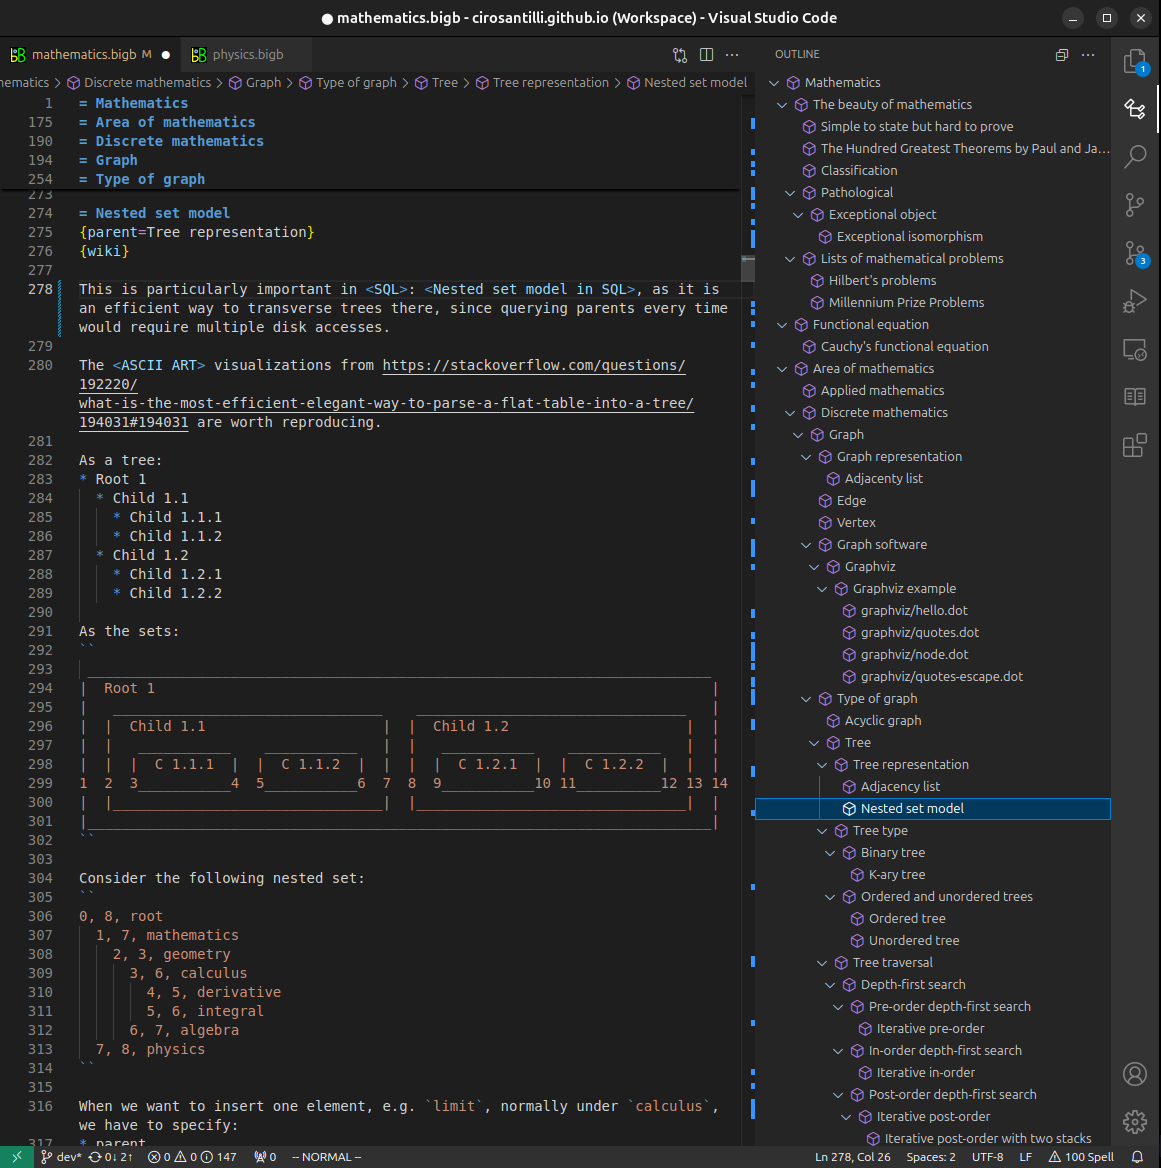
- Infinitely deep tables of contents:

All our software is open source and hosted at: github.com/ourbigbook/ourbigbook
Further documentation can be found at: docs.ourbigbook.com
Feel free to reach our to us for any help or suggestions: docs.ourbigbook.com/#contact