Fourier transform microwave spectroscopy excites gaseous molecules with a pulse of electromagnetic radiation, then records the emitted time-dependent electric field. A Fourier transform extracts transition frequencies from the decaying signal. In a cavity implementation, two facing mirrors form a resonator; tuned excitation, receiver electronics and digitization replace the molecule-counting readout of molecular beam electric resonance. The pulsed radiation prepares quantum coherence between rotational quantum states; it does not set the whole gas spinning at one classical angular velocity.
For documented laboratory context, Evolution of Microwave Spectroscopy at the National Bureau of Standards (NBS) and the National Institute of Standards and Technology (NIST) by F. J. Lovas and others (§5, printed pp. 280–282) describes the NIST cavity instrument, phase-locked sources, mirror tuning and detector-mixer modifications. That account explains one instrument family; it does not establish the electronics of every later commercial spectrometer.
The NIST validation report used carbonyl sulfide in argon to illustrate the readout. A pulsed nozzle injected a molecular beam along a two-mirror cavity. Approximately excitation prepared quantum coherence; a receiver digitized the decaying electric field, then a Fourier transform produced spectral lines. Counterpropagating cavity waves produced a Doppler shift doublet; its midpoint represents one rest-frame transition.[ref]
The Validation of Fourier-Transform Microwave Spectroscopy for Trace-Gas Analysis. The Validation of Fourier-Transform Microwave Spectroscopy for Trace-Gas Analysis, printed pp. 25–26, Figures 2–3: coaxial apparatus, excitation and OCS readout; PDF pages 31–32
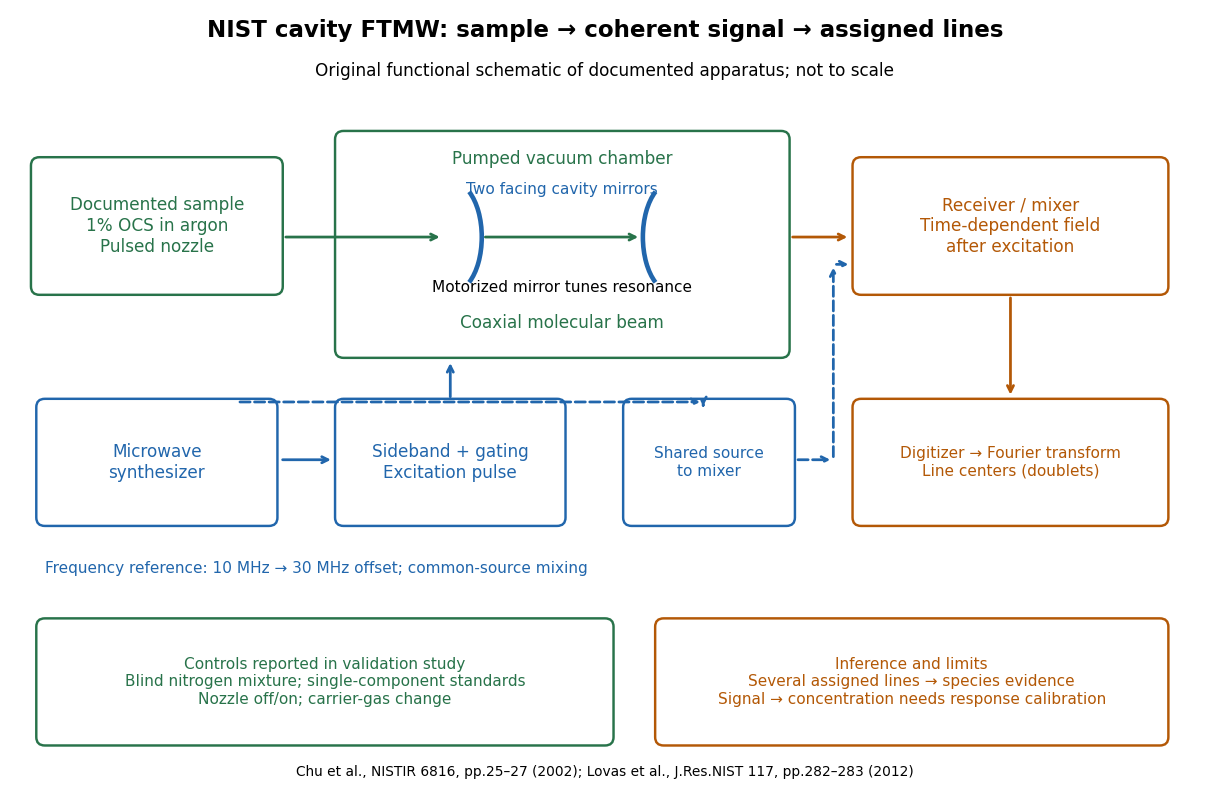
Original functional schematic of the NIST trace-gas FTMW validation experiment
. An original arrangement of the documented sample, cavity, excitation and readout functions; no published figure is copied. The frequency-reference branch summarizes the later portable electronics described in the NIST historical account. The sample fraction is a reported preparation, not a synthetic measured spectrum. Details.
The portable electronics used a common microwave source and a offset derived from a reference. Cavity tuning selects the accessible band; it does not independently calibrate the line's frequency. Absolute accuracy also requires a characterized reference and receiver offset.[ref]
Evolution of Microwave Spectroscopy at the National Bureau of Standards (NBS) and the National Institute of Standards and Technology (NIST) by F. J. Lovas and others. §5, printed pp. 282–283, Figure 20: source splitting, frequency reference, single-sideband modulation, mixer and digitizer
Reported controls included nozzle off/on, carrier-gas changes, and a blind nitrogen mixture. Assigned components were correctly identified. Single-component standards supplied preliminary concentration calibration; one standard per quantified component left response validation incomplete. Condensation and departure from thermal equilibrium in the nozzle were acknowledged limitations.[ref]
The Validation of Fourier-Transform Microwave Spectroscopy for Trace-Gas Analysis. printed pp. 26–27: nozzle/carrier comparison in Figure 6, blind mixture in Table II, one-standard calibration and nozzle-expansion limitations
The lesson is that rotational spectral line assignment and concentration inference answer different questions. Reproducible frequencies support molecular identity; converting signal size into concentration requires calibrated response under the same transfer and excitation conditions. The thermal absorption example above does not model a nozzle's nonequilibrium populations or the cavity's pulsed response.
A distinct experiment in An Automated, Highly Selective Reaction Monitoring Instrument Using Molecular Rotational Resonance Spectroscopy by Ann Adele Byars and others (Figure 1 and Figure 3) tracked exchange of hydrogen for deuterium in ethyl acetoacetate mixed with deuterated methanol. A pump circulated chemical solution through a valve; a calibrated loop injected aliquots into a temperature-controlled inlet, held at room temperature for this exchange experiment. Neon carried the vaporized sample to a cavity spectrometer. Separately recorded broadband spectra and fitted rotational Hamiltonians identified transitions for the four isotopic forms before targeted monitoring.[ref]
An Automated, Highly Selective Reaction Monitoring Instrument Using Molecular Rotational Resonance Spectroscopy by Ann Adele Byars and others. apparatus and assignment paragraphs around Figure 1; deuterium-exchange method and Figure 3
The readout was each assigned line's signal over reaction time, normalized by the sum of the four signals. Transitions with the same quantum numbers reduced response-factor differences. A solvent wash addressed observed sample carryover. The signals distinguished the unsubstituted, two singly substituted, and doubly substituted forms. Only one gas-phase structural form was detected; the authors explicitly caution that their readout does not recover the structural chemical equilibrium in chemical solution.[ref]
An Automated, Highly Selective Reaction Monitoring Instrument Using Molecular Rotational Resonance Spectroscopy by Ann Adele Byars and others. deuterium-exchange paragraphs surrounding Figure 3; sample carryover and wash paragraph
This example uses nonlinear molecules, so neither the single-constant linear rigid rotor nor the synthetic comb above is a fit to its spectrum. Its connection to the model is the sensitivity of moments of inertia to isotope placement. Line position helps assign a species; signal size additionally depends on sample transfer, initial quantum state populations and instrument response. Matching quantum numbers is a useful control, not a proof of identical response factors. These distinctions explain why resolving species and determining their concentrations are separate inference steps.
Articles by others on the same topic
There are currently no matching articles.