Suppose , , are independent and identically distributed with Laplace distribution , where . For realized values , the likelihood function and log-likelihood function areFor fixed , maximum likelihood estimation of the location therefore minimizes the sum of absolute losses. This connects the Laplace distribution to robust statistics: each observation contributes a cost growing linearly with its distance, whereas squared-error loss grows quadratically.
Why does a sample median minimize ? Between successive order statistics, moving a little to the right increases each distance to a value on the left and decreases each distance to a value on the right. Hence the slope is the number on the left minus the number on the right. It changes from negative to positive at the middle. More precisely, if , all minimizing locations areFor an even sample size, the objective is flat throughout the interval between the two central order statistics. The midpoint convention for the sample median selects one solution; it does not prove uniqueness. [ref]
Laplace (Double Exponential, Bilateral Exponential) Distribution. SciPy 1.18.0 documentation; SciPy reference guide, Laplace distribution, ML location estimator and the even-N interval between the two central order statistics
This is the finite-sample counterpart of median minimizes expected absolute loss.If , maximizing over givesThe derivative is positive below this value and negative above it. Moreover the maximized likelihood function is proportional to wherever , so the same minimizing locations give the joint maximum-likelihood estimates. [ref]
1.3.6.6.12. Double Exponential Distribution. NIST and SEMATECH e-Handbook of Statistical Methods; NIST/SEMATECH e-Handbook, Section 1.3.6.6.12, Parameter Estimation; median and average absolute deviation formulas
The scale estimate divides by ; this formula is not an assertion that it is an unbiased estimator.The boundary case matters: if all observations equal , choose . Then and as . There is no finite joint maximum-likelihood estimate in the parameter space . In particular, this always occurs for . Writing does not produce an admissible Laplace distribution.
Choose the five numbers as an original illustration. Their sample median is 2 and their sample mean is 4. The sum of absolute losses at the sample median isIf these numbers were modeled as an independent and identically distributed Laplace distribution sample, the joint maximum-likelihood estimates would therefore be and . Using the sample mean instead gives , so it does not maximize this likelihood function.
Now replace only 10 by 100. The sample median stays at 2, while the sample mean becomes . The minimized sum of absolute losses rises to , and the fitted scale rises to . Stability of the fitted location therefore does not mean stability of every fitted parameter.
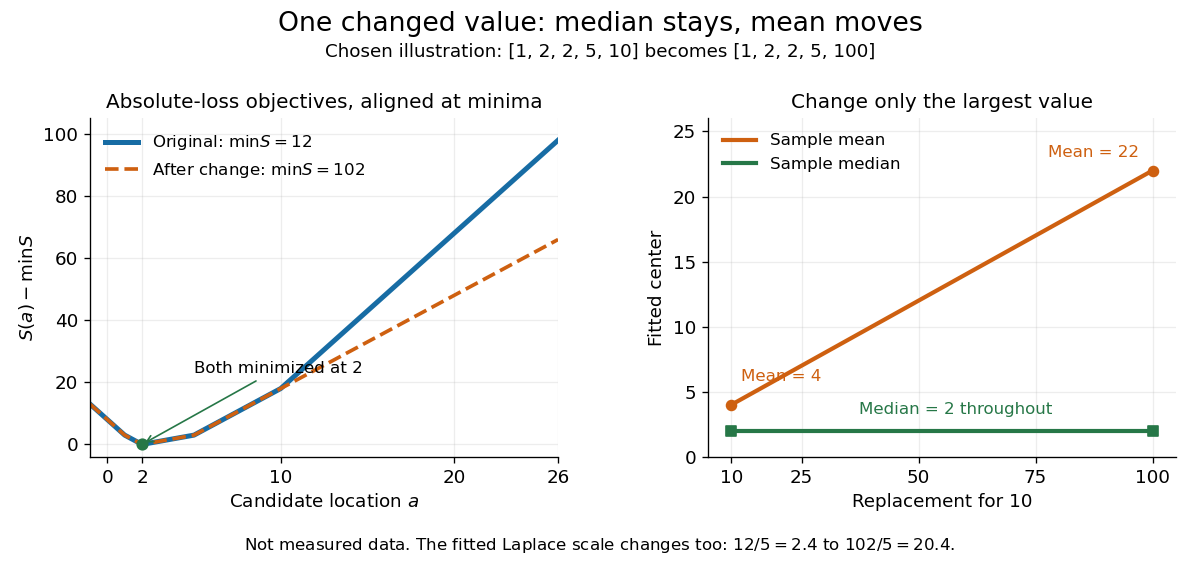

The left panel subtracts each objective's minimum so the two absolute loss curves can be compared despite the different totals. The right panel tracks the sample mean and sample median as the largest chosen value changes. This is an outlier sensitivity illustration, not actual observations or a check that a Laplace distribution fits any population. In applications, regression residuals and the data-generating assumptions need separate examination; a stable sample median alone does not validate a statistical model.
Articles by others on the same topic
There are currently no matching articles.