Read the straight-line extrapolation on the logarithmic dose axis, rather than the rounded shoulder of the measured curve. The retention and clearing intercepts are approximately and . Thus the photoresist contrast isHere the subscripts denote the two dose thresholds used in the supplied definition. The physical positive-resist curve decreases with exposure; is the higher clearing dose in that definition, not a statement that the film retains its full thickness there. Graphical intercepts justify roughly two significant figures.
Use exposure dose , with . At approximately and , the positive resist just starts to thin. The intensity there is about , soAs a consistency check, the fully cleared region begins at approximately and ends at , where the intensity is about . Multiplying by gives the clearing dose at both edges.
A fully clear opening requires the higher clearing threshold, not merely the onset of thinning. At ,The intensity curve crosses this level at about and . Therefore the clear opening is approximatelyThe longer exposure widens the opening because even the relatively dim image tails now accumulate enough exposure dose to clear the positive photoresist. The edge readings are approximate; interpolating a plotted curve does not support nanometre precision.
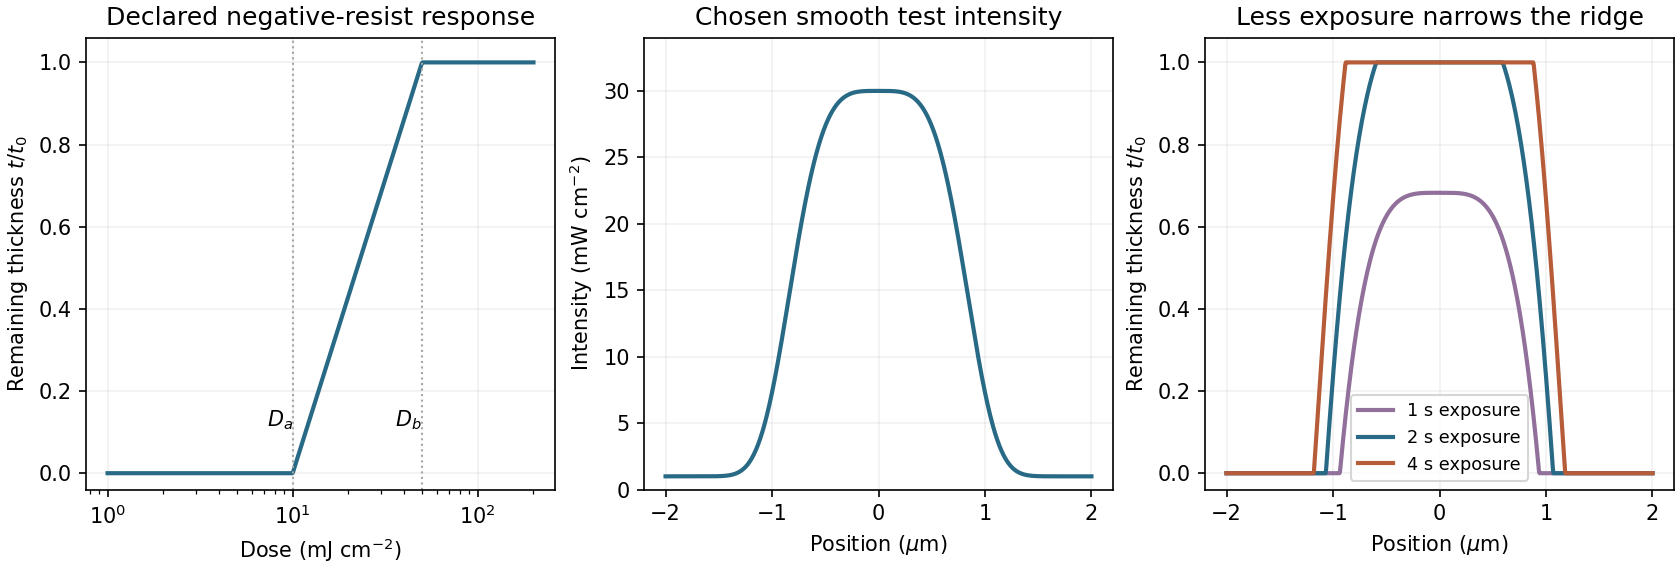
A negative photoresist is removed at low dose and retained at high dose. Its remaining-thickness curve rises from zero above a gel or retention threshold and approaches one above a larger full-retention threshold. A useful schematic model isThe developed profile is . A central intensity maximum therefore leaves a central ridge, with cleared regions towards the darker sides. Halving exposure narrows and can lower the retained ridge; doubling it broadens the ridge and can raise its shoulders. A saturated central plateau cannot become thicker than the original film in this simple model. If the half-dose peak is below , no ridge survives; if it lies between and , the centre survives only partially.
The negative-resist thresholds are not supplied, so there is no unique numerical profile or linewidth. The original schematic below declares its own illustrative thresholds and intensity function; it explains the dose mapping without treating a positive-resist curve as measured negative-resist data.

Articles by others on the same topic
There are currently no matching articles.