Read the straight-line extrapolation on the logarithmic dose axis, rather than the rounded shoulder of the measured curve. The retention and clearing intercepts are approximately and . Thus the photoresist contrast isHere the subscripts denote the two dose thresholds used in the supplied definition. The physical positive-resist curve decreases with exposure; is the higher clearing dose in that definition, not a statement that the film retains its full thickness there. Graphical intercepts justify roughly two significant figures.
Use exposure dose , with . At approximately and , the positive resist just starts to thin. The intensity there is about , soAs a consistency check, the fully cleared region begins at approximately and ends at , where the intensity is about . Multiplying by gives the clearing dose at both edges.
A fully clear opening requires the higher clearing threshold, not merely the onset of thinning. At ,The intensity curve crosses this level at about and . Therefore the clear opening is approximatelyThe longer exposure widens the opening because even the relatively dim image tails now accumulate enough exposure dose to clear the positive photoresist. The edge readings are approximate; interpolating a plotted curve does not support nanometre precision.
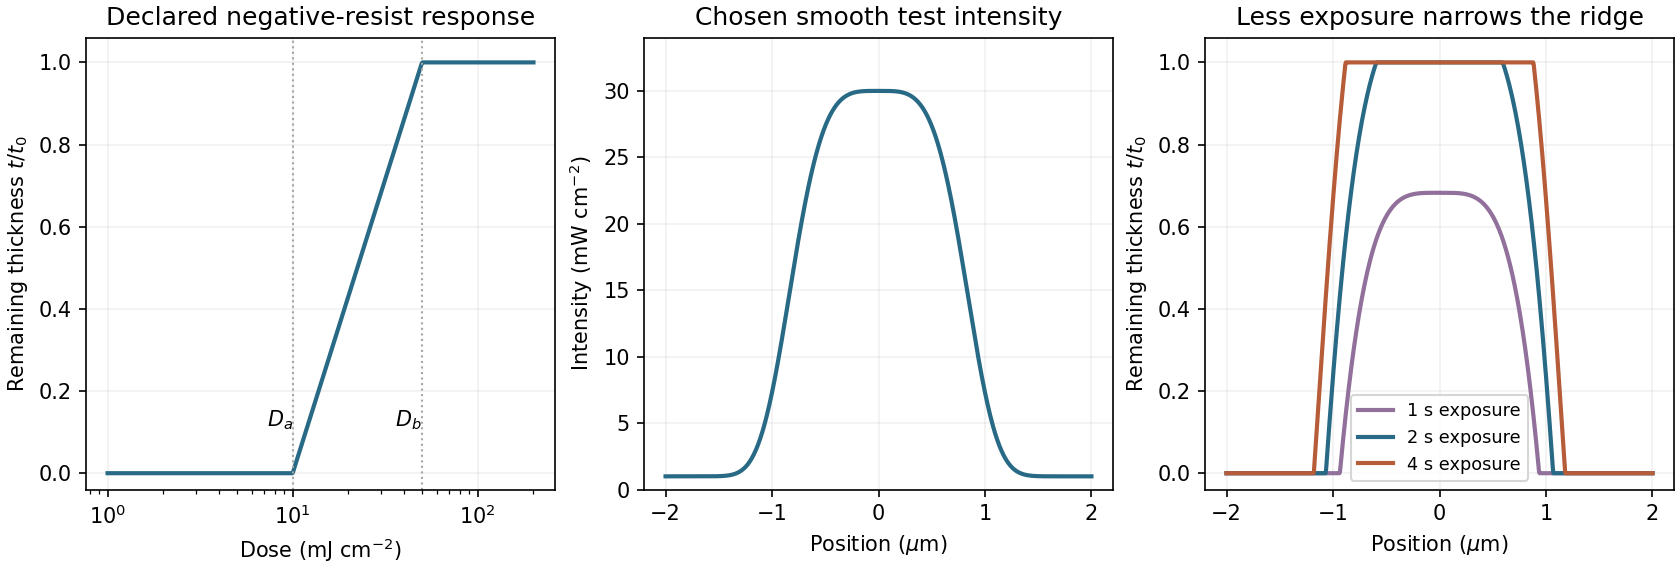
A negative photoresist is removed at low dose and retained at high dose. Its remaining-thickness curve rises from zero above a gel or retention threshold and approaches one above a larger full-retention threshold. A useful schematic model isThe developed profile is . A central intensity maximum therefore leaves a central ridge, with cleared regions towards the darker sides. Halving exposure narrows and can lower the retained ridge; doubling it broadens the ridge and can raise its shoulders. A saturated central plateau cannot become thicker than the original film in this simple model. If the half-dose peak is below , no ridge survives; if it lies between and , the centre survives only partially.
The negative-resist thresholds are not supplied, so there is no unique numerical profile or linewidth. The original schematic below declares its own illustrative thresholds and intensity function; it explains the dose mapping without treating a positive-resist curve as measured negative-resist data.
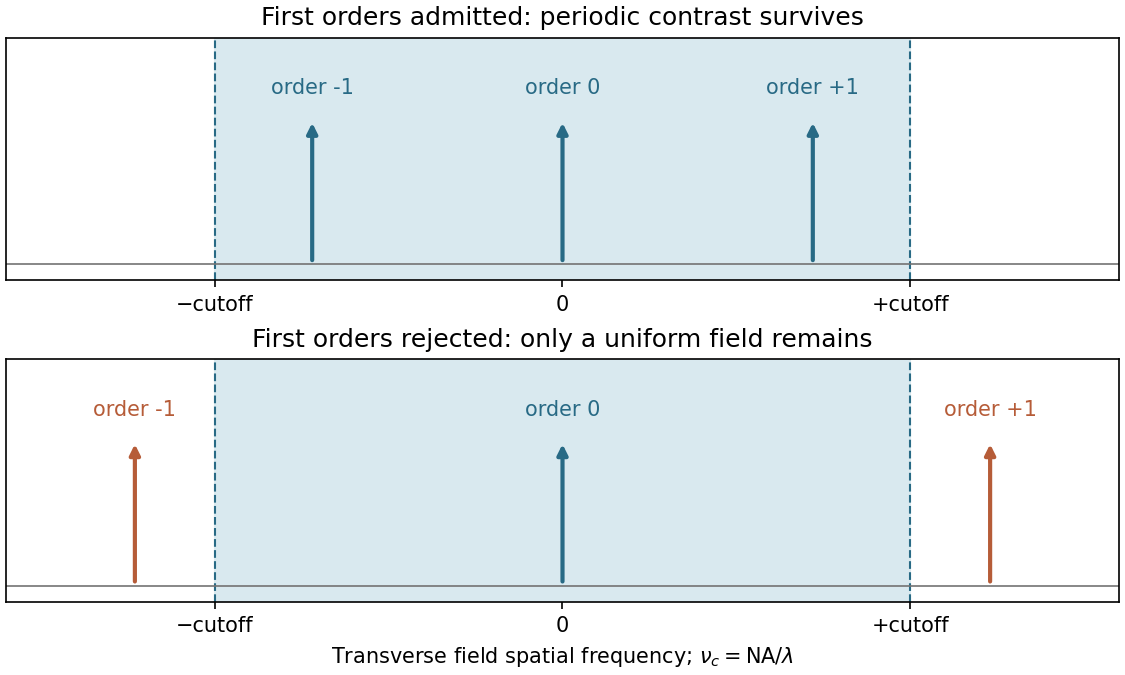
Take the ArF wavelength as and assume an on-axis coherent illuminator. A grating of period has diffraction orders with transverse spatial frequencies . To reproduce amplitude modulation, the pupil must pass the zero order and at least the first spatial-frequency components. For symmetric on-axis illumination this requires .
For equal lines and spaces, the printed feature width is the half-pitch . The ideal limiting values are thereforeThese are limiting values approached from within the pupil, with adequate mask contrast and a suitable resist; a weakly modulated mask need not supply sufficient image contrast. They are not the Rayleigh separation of two incoherent point objects. Off-axis coherent illumination can shift the admitted orders and changes this particular geometry.
The projection lens maps the mask's angular spectrum into its back focal plane: within scalar Fourier optics this is the Fraunhofer diffraction or spatial-Fourier plane. A periodic mask produces discrete diffraction orders, separated by in object-side spatial frequency after accounting for projection magnification. The finite numerical aperture bounds the transverse wave vectors admitted by the lens, so the pupil is a spatial-frequency filter.
For an ideal on-axis coherent system,A second Fourier transformation forms the image, and the recorded intensity is . If only the zero order passes, the field is uniform and the line pattern disappears. Passing zero and first orders restores a periodic modulation; passing more orders sharpens the edges. Thus the loss of fine structure is explained by rejected diffraction orders, not by a geometrical inability to draw narrow lines. The field-transfer cutoff differs from the twice-as-large incoherent intensity-transfer cutoff.[ref]
Advanced Optical Imaging: Incoherent imaging by Delft University of Technology. coherent and incoherent transfer: pupil filtering and intensity formation


Increasing the angular acceptance can collect higher spatial frequencies, but rays at large angles and away from the optical axis are harder to bring to the same focus. Spherical aberration, coma, astigmatism and field curvature can degrade contrast across a large exposure field. The depth of focus also decreases approximately as , making wafer height errors more important. A larger geometrical aperture is therefore not automatically better over the whole wafer field.
Immersion lithography raises by increasing the refractive index of the medium between the final lens and wafer. A suitable UV-transparent liquid permits a larger numerical aperture without increasing the ray angle by the same factor, easing the purely geometrical demand on the lens. Lens design and focus control remain necessary; immersion does not abolish aberrations. The liquid must also be compatible with the resist and free of bubbles and contamination, and absorption at must be low.
Articles by others on the same topic
There are currently no matching articles.