Source: NanoMPhil Paper 1 2022.pdf, physical pages 1–16 of that ZIP member; questions occupy pages 3–16.
Diffraction contrast arises because elastic scattering transfers transmitted electron intensity between the direct beam and Bragg diffraction beams. A local change in crystal orientation, strain or thickness changes that transfer. An objective aperture selecting the direct beam makes strongly diffracting regions relatively dark in bright-field transmission electron microscopy; selecting a diffracted beam reverses the selection in dark-field transmission electron microscopy. This is a change in scattering conditions, not necessarily a change in chemical composition.
Three characteristic effects are bend contours, thickness fringes and dislocation contrast. Bend contours follow positions where a gently curved crystal meets a particular Bragg diffraction condition. Thickness fringes arise from thickness-dependent exchange of intensity between coupled transmitted and diffracted waves. A dislocation distorts nearby planes, changing their diffraction condition and producing localized contrast; changing the diffraction vector can suppress particular dislocations. Moiré fringes from overlapping lattices provide another acceptable example, but their coarse spacing is a beat spacing rather than an atomic spacing.
Use conventional bright-field transmission electron microscopy, with nearly parallel illumination, a suitably small objective aperture and low magnification covering the whole cross-section. More strongly scattering material sends more intensity outside the selected central beam and therefore looks darker. Tilt crystalline layers away from strong Bragg diffraction conditions to reduce diffraction contrast, and use a near-focus image so that electron phase contrast does not dominate.
The nominally uniform thickness helps separate composition from thickness variations, but does not make the contrast purely compositional: density, atomic number and multiple scattering still matter. Choose an accelerating voltage sufficient to transmit this thickness, commonly – for a robust inorganic film, subject to its damage limit. High-angle annular dark-field imaging in scanning transmission electron microscopy is a useful alternative for approximately monotonic mass-thickness contrast, but is a different acquisition mode and still requires thickness and detector-angle control.
Use a low-dose, dose-efficient acquisition rather than assuming that a lower accelerating voltage is always gentler. Focus and align on a sacrificial neighbouring region, blank the beam between exposures, illuminate only when recording and use an efficient detector. A broad, low-current-density transmission electron microscopy exposure can avoid a high instantaneous local dose; scanning can also work if probe current, dwell time and repeated visits are controlled.
Radiolysis starts with inelastic scattering and ionization. For an appropriate thin specimen, increasing the electron energy can reduce the inelastic interaction probability and energy deposition per incident electron, so a relatively high voltage can help. However, increasing voltage can also activate knock-on displacement. The optimum therefore depends on the material and the amount of useful information obtained per damaging event; alone does not determine it. Cooling may reduce diffusion-driven chemical changes but does not eliminate primary ionization. An experimental study of nonbiological layered polymer films explicitly found that the voltage choice must balance damage with image signal.[ref]
Optimal acceleration voltage for near-atomic resolution imaging of layer-stacked 2D polymer thin films by Baokun Liang and others. 2022, accelerating-voltage comparison and discussion of the inelastic scattering cross-section
Use high-resolution transmission electron microscopy with a coherent, well-aligned beam and an objective aperture admitting the direct beam and the spatial frequencies required at the interface. Orient a crystalline region near a suitable zone axis so that useful lattice fringes are excited; minimize drift, vibration and astigmatism. Choose defocus and aberration correction to transfer the target frequencies, rather than treating the image as a direct map of atoms at arbitrary defocus.
An aberration-corrected scanning transmission electron microscopy probe with high-angle annular dark-field imaging can instead resolve an interface with more directly interpretable atomic-number contrast. A nominal thickness may be too great for clean atomic-resolution interpretation: thin the interface further if necessary, finish focused ion beam milling at lower ion energy to reduce damaged surface layers, and check for curtaining and implantation. The best mode depends on crystallinity and damage sensitivity; an amorphous interface calls for resolving its boundary and composition rather than inventing lattice fringes.
In piezoresponse force microscopy, a conducting atomic force microscopy tip contacts a sample with a counter-electrode. Apply . The converse piezoelectric effect produces an oscillatory displacement, approximately . Contact with the moving surface bends the cantilever, and a lock-in amplifier records the displacement amplitude and phase relative to the drive.
For opposite out-of-plane ferroelectric domains, the effective piezoelectric coefficient changes sign. Their vertical response therefore differs by approximately in phase. Equivalent antiparallel domains can have similar amplitudes, while cancellation or reduced response near a wall can produce an amplitude minimum. Phase identifies the relative response sign; an uncalibrated detector phase is not an absolute polarization direction.
Use a small drive below the switching threshold while imaging, a stable contact force and a well-characterized contact resonance. Electrostatic forces, contact stiffness and surface charging can also create signals at the drive frequency; observing contrast alone is insufficient evidence for polarization switching.[ref]
Imaging mechanism of piezoresponse force microscopy of ferroelectric surfaces by Sergei V. Kalinin and Dawn A. Bonnell. 2002, electromechanical and electrostatic contrast regimes
Measure cantilever torsion with the lateral channel of a four-quadrant optical detector. An in-plane surface displacement perpendicular to the cantilever axis twists the cantilever. The reflected laser spot moves sideways, so the left-minus-right detector signal, demodulated at by a lock-in amplifier, gives the amplitude and phase of the lateral piezoresponse. The top-minus-bottom signal primarily records bending.
Displacement along the cantilever axis can instead cause buckling and leak into the nominally vertical channel. Rotate the specimen by and repeat the measurement to sample the other in-plane component; use a reference specimen and sensitivity calibration before converting a voltage into displacement or force. A torsional spring constant and lever-arm calibration are additionally needed for an actual lateral-force value. Thus lateral piezoresponse is not automatically a calibrated force measurement.
A surface slope converts some vertical displacement into lateral motion of the tip and changes the normal contact geometry. Roughness also changes friction, contact area and local contact stiffness, and can mix cantilever bending, buckling and torsion. A lateral image that follows a height gradient can therefore appear even when the relevant in-plane polarization component is absent.
Record topography and both piezoresponse force microscopy channels simultaneously, and compare the lateral signal with the local slope rather than height alone. Reverse the scan direction to identify frictional contributions, rotate the sample relative to the cantilever, and compare the vector transformation expected for an in-plane response with the geometrical cross-talk. Repeat on a smoother region or a polished specimen, at controlled force and drive amplitude. Track contact resonance or compare sufficiently far from it so that local stiffness does not masquerade as a change in response.
A useful control is a nonpiezoelectric surface of similar roughness. Electrically switching a domain while leaving its topography unchanged provides a further comparison when feasible. No single trace–retrace test proves the absence of cross-talk: genuine in-plane response and slope-induced signals can both transform under rotation, so several controls must agree.
Read the straight-line extrapolation on the logarithmic dose axis, rather than the rounded shoulder of the measured curve. The retention and clearing intercepts are approximately and . Thus the photoresist contrast isHere the subscripts denote the two dose thresholds used in the supplied definition. The physical positive-resist curve decreases with exposure; is the higher clearing dose in that definition, not a statement that the film retains its full thickness there. Graphical intercepts justify roughly two significant figures.
Use exposure dose , with . At approximately and , the positive resist just starts to thin. The intensity there is about , soAs a consistency check, the fully cleared region begins at approximately and ends at , where the intensity is about . Multiplying by gives the clearing dose at both edges.
A fully clear opening requires the higher clearing threshold, not merely the onset of thinning. At ,The intensity curve crosses this level at about and . Therefore the clear opening is approximatelyThe longer exposure widens the opening because even the relatively dim image tails now accumulate enough exposure dose to clear the positive photoresist. The edge readings are approximate; interpolating a plotted curve does not support nanometre precision.
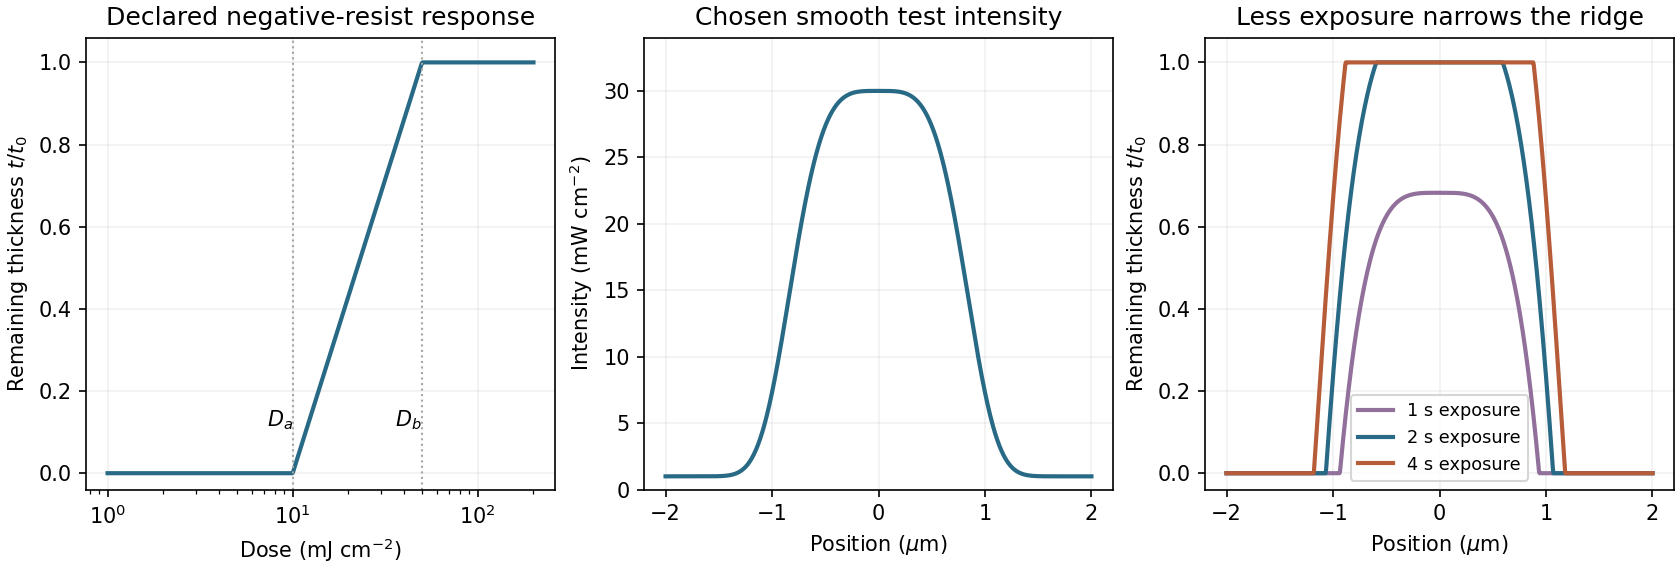
A negative photoresist is removed at low dose and retained at high dose. Its remaining-thickness curve rises from zero above a gel or retention threshold and approaches one above a larger full-retention threshold. A useful schematic model isThe developed profile is . A central intensity maximum therefore leaves a central ridge, with cleared regions towards the darker sides. Halving exposure narrows and can lower the retained ridge; doubling it broadens the ridge and can raise its shoulders. A saturated central plateau cannot become thicker than the original film in this simple model. If the half-dose peak is below , no ridge survives; if it lies between and , the centre survives only partially.
The negative-resist thresholds are not supplied, so there is no unique numerical profile or linewidth. The original schematic below declares its own illustrative thresholds and intensity function; it explains the dose mapping without treating a positive-resist curve as measured negative-resist data.
Take the ArF wavelength as and assume an on-axis coherent illuminator. A grating of period has diffraction orders with transverse spatial frequencies . To reproduce amplitude modulation, the pupil must pass the zero order and at least the first spatial-frequency components. For symmetric on-axis illumination this requires .
For equal lines and spaces, the printed feature width is the half-pitch . The ideal limiting values are thereforeThese are limiting values approached from within the pupil, with adequate mask contrast and a suitable resist; a weakly modulated mask need not supply sufficient image contrast. They are not the Rayleigh separation of two incoherent point objects. Off-axis coherent illumination can shift the admitted orders and changes this particular geometry.
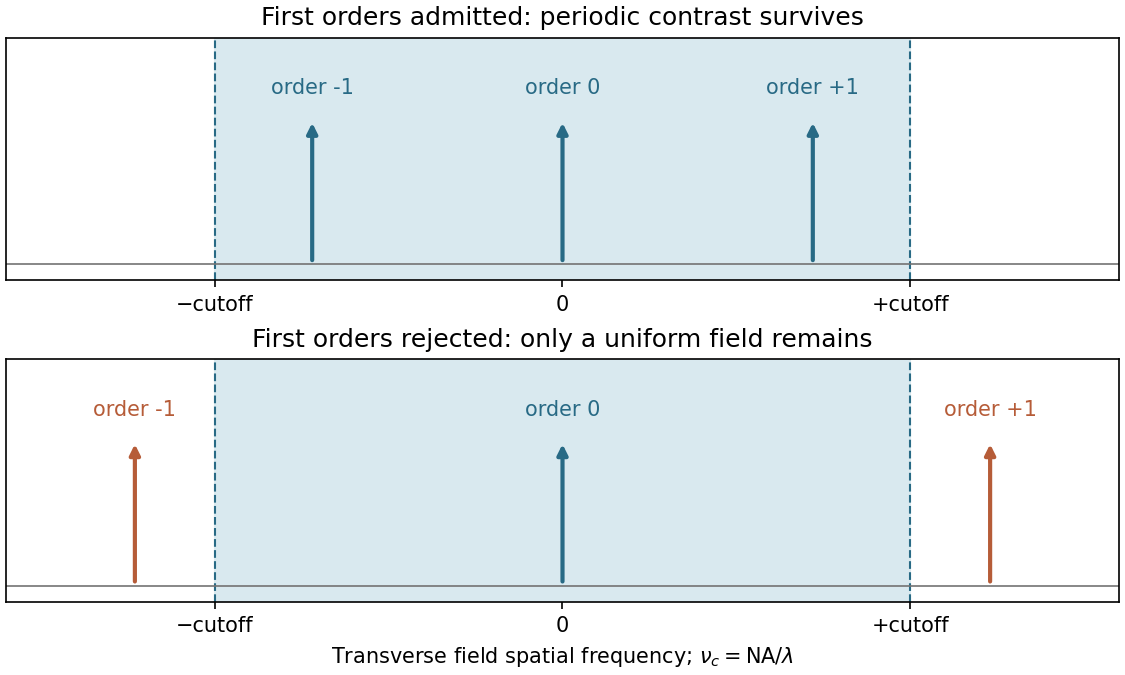
The projection lens maps the mask's angular spectrum into its back focal plane: within scalar Fourier optics this is the Fraunhofer diffraction or spatial-Fourier plane. A periodic mask produces discrete diffraction orders, separated by in object-side spatial frequency after accounting for projection magnification. The finite numerical aperture bounds the transverse wave vectors admitted by the lens, so the pupil is a spatial-frequency filter.
For an ideal on-axis coherent system,A second Fourier transformation forms the image, and the recorded intensity is . If only the zero order passes, the field is uniform and the line pattern disappears. Passing zero and first orders restores a periodic modulation; passing more orders sharpens the edges. Thus the loss of fine structure is explained by rejected diffraction orders, not by a geometrical inability to draw narrow lines. The field-transfer cutoff differs from the twice-as-large incoherent intensity-transfer cutoff.[ref]
Advanced Optical Imaging: Incoherent imaging by Delft University of Technology. coherent and incoherent transfer: pupil filtering and intensity formation


Increasing the angular acceptance can collect higher spatial frequencies, but rays at large angles and away from the optical axis are harder to bring to the same focus. Spherical aberration, coma, astigmatism and field curvature can degrade contrast across a large exposure field. The depth of focus also decreases approximately as , making wafer height errors more important. A larger geometrical aperture is therefore not automatically better over the whole wafer field.
Immersion lithography raises by increasing the refractive index of the medium between the final lens and wafer. A suitable UV-transparent liquid permits a larger numerical aperture without increasing the ray angle by the same factor, easing the purely geometrical demand on the lens. Lens design and focus control remain necessary; immersion does not abolish aberrations. The liquid must also be compatible with the resist and free of bubbles and contamination, and absorption at must be low.
Use consistent units for the Gibbs free energy:Then givesThis is a dimensionless thermodynamic equilibrium constant defined through activities. For an ideal dilute association, the numerical concentration association constant is about when concentrations use the standard state. Both favourable enthalpy and positive entropy favour association here; association need not always have a negative entropy change because solvent release can outweigh the loss of translational freedom.
Cyclodextrins are truncated-cone-shaped hosts that form host–guest complexes. Their hydroxyl-rich exterior interacts favourably with water, while the internal cavity is relatively nonpolar and can accommodate a suitably sized organic guest. The six-, seven- and eight-unit rings have different cavity sizes, so shape and size selectivity matter. Binding can involve London dispersion forces, displacement of cavity water and changes in solvation; no covalent modification of the guest is necessary.
An odorous organic guest can be included in the cavity, decreasing its free concentration and hence its tendency to enter the vapour phase. The same inclusion chemistry can increase the apparent aqueous solubility of a poorly soluble compound, and reversible association allows release when conditions or concentrations change. In a separation, guests with different association constants partition differently between free and bound states; a suitably immobilized host can therefore act as a selective stationary phase.
The unifying mechanism is reversible molecular inclusion in a size-selective cavity. These are chemical explanations of binding and partitioning. Biological action, therapeutic efficacy and physiological delivery mechanisms are outside the present nonbiology scope.
The gas-phase attraction is a cation–π interaction. The positively charged ion interacts with benzene's electron distribution and polarizes the aromatic molecule. An orientation above the ring face allows stabilization without a conventional covalent bond. A modest association constant reflects the balance of that attraction against the entropy cost of joining two independent species, at the stated gas-phase standard state.
In water, a small ion such as is strongly solvated. Forming a direct benzene complex requires rearranging or losing favourable ion–water contacts; benzene is also solvated, and the solvent screens electrostatic interactions. The relevant solution free energy therefore includes desolvation and solvent reorganization, not just the attractive energy of the isolated pair. The gas-phase association constant cannot be transferred to water without changing this thermodynamic cycle and the standard states. The interaction is not forbidden in solution, but it need not give appreciable direct complexation under the specified conditions.
The receptor is a triazolophane with a relatively rigid central cavity. Its inward-facing triazole and phenylene C–H groups act cooperatively as hydrogen bond donors to an anion. The supplied preference is , so it is not a simple ranking by charge density or basicity.
Chloride has the best fit for several favourable C–H···anion contacts simultaneously; bromide is close enough in size to retain strong binding. Fluoride is too small to engage the whole donor array optimally, and its desolvation penalty can further oppose binding in solution. Iodide is too large for the cavity and cannot sit in the same favourable geometry. Molecular preorganization reduces the conformational penalty for binding a matched guest, but makes the cavity less adaptable to mismatched ones.
The exact solvent is not specified in this question, so a quantitative hydration argument would be unwarranted. The structure and observed nonmonotonic order support size complementarity plus cooperative C–H hydrogen bonding, with solvation modifying the measured constants. The original receptor study experimentally demonstrated halide size selectivity and tunability through the phenylene substituents.[ref]
Size-selective halide binding by Yongjun Li and Amar H. Flood. 2008, halide-binding investigations and cavity-size comparison
Take unit activity of each dissolved metal ion, unit activity of each metal, and . The hydrogen-electrode Nernst equation givesThus at pH 1 and at pH 14. For corrosion coupled to hydrogen evolution,For alkaline solution the same electron balance can be written , before allowing for metal-ion hydrolysis or complexation. Using for zinc and lead, and for lithium, the results per mole of metal areLithium is strongly unstable against hydrogen evolution in both media in this model. The positive alkaline values for zinc and lead apply to the stipulated unit-activity free-ion products; they are not complete predictions of alkaline corrosion once hydroxide precipitation and complexation change the product chemical potentials.
A useful aqueous anode must deliver the desired oxidation current while limiting parasitic corrosion and hydrogen evolution. Thermodynamics sets the driving force, while activation overpotential, surface films and mass transport control the rate.
For zinc, the acid calculation favours dissolution with hydrogen evolution, but a substantial kinetic barrier to hydrogen evolution on a clean zinc surface can slow this loss. Impurities and catalytic inclusions can increase it. In alkaline electrolyte, zinc can be useful in batteries, but the unit-activity calculation is incomplete: soluble zincate and zinc oxide or hydroxide alter the relevant equilibrium. A surface film can protect against corrosion or obstruct useful discharge, depending on its conductivity and transport properties.
For lead, acid corrosion has a much smaller driving force in the stipulated model, and slow hydrogen kinetics can permit practical use. The electrolyte anion matters: a lead sulfate layer in a lead–acid system has a different role from arbitrary soluble lead salts. In alkaline media, hydroxide formation, soluble complexes and passivation again need consideration before drawing a practical conclusion from the free-ion potential.
Metallic lithium is unsuitable as an exposed anode in an ordinary aqueous electrolyte. Its strongly favourable reaction with water overwhelms the argument for simply relying on a hydrogen overpotential. A lithium-ion host electrode is a different material and must be judged by its own operating potential and interfacial chemistry.
A conventional capacitor stores separated electronic charge across a dielectric, with capacitance set approximately by . An electric double-layer capacitor stores charge at the interface between a porous electronic conductor and an ionic electrolyte. Electrolyte counterions screen charge on the electrode over a very small interfacial separation, and a porous electrode provides a large accessible area. The separator prevents an electronic short while permitting ionic transport; the two electrode interfaces form series capacitances.
Pseudocapacitance is charge storage by fast, reversible Faradaic processes that give a capacitor-like relation between stored charge and potential over a useful range. Examples include surface redox and suitably rapid insertion processes. It is distinct from purely electrostatic double-layer charging. Merely observing a redox peak does not establish pseudocapacitive behaviour: a slow two-phase battery reaction can remain battery-like even when its electrode is nanostructured.
For constant current and nearly constant capacitance,An ideal supercapacitor therefore has approximately linear charge and discharge ramps, making a triangular voltage–time trace. Series resistance adds an immediate voltage step when current starts and a step of magnitude when it reverses directly from to . Leakage and voltage-dependent capacitance introduce curvature.
A secondary battery instead follows electrode chemical potentials as its state of charge changes; many chemistries have broad plateaus or sloping plateaus, with polarization separating the charge and discharge curves. This distinction is typical rather than universal: some batteries have steeply sloping profiles, while strongly potential-dependent pseudocapacitive materials can depart substantially from a triangle.
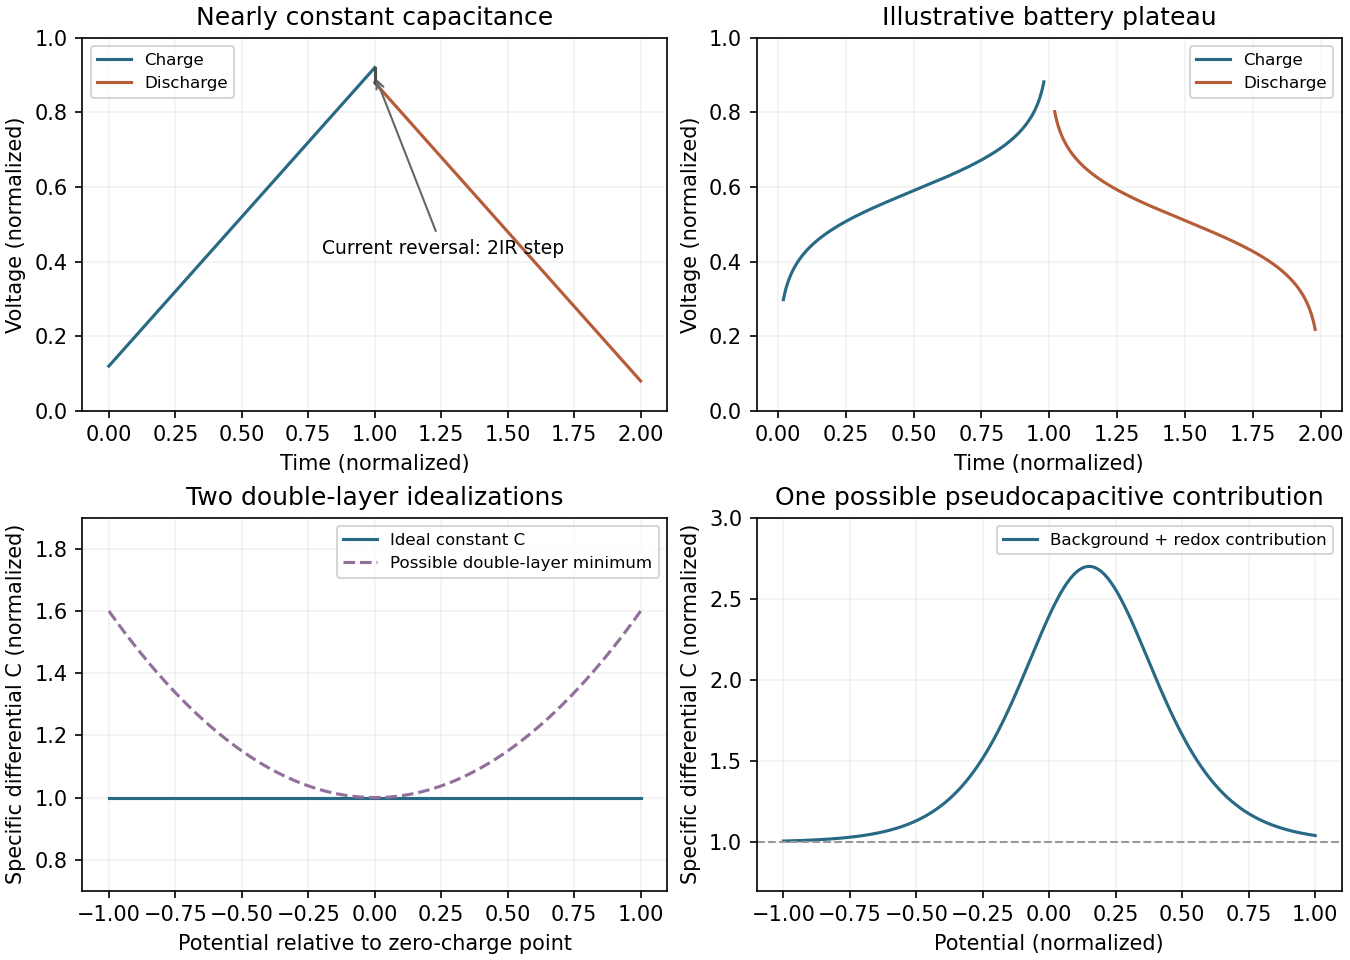
Idealized supercapacitor and battery responses, with capacitance–potential alternatives
. Original schematic curves; the lower panels distinguish a constant differential capacitance, a double-layer minimum and a localized redox contribution. They are alternative models, not a universal measured curve. Details.
Define mass-specific differential capacitance, or specific capacitance, byState whether is one electrode's active mass, both electrodes' active mass or the entire device mass; these conventions are not interchangeable. An average capacitance inferred from a finite voltage interval is and need not equal the local derivative.
A nearly ideal double-layer supercapacitor has an approximately flat capacitance over its stable operating window, so stored charge rises nearly linearly with potential. Real electrodes need not be flat: dilute-electrolyte double-layer models can give a minimum near the potential of zero charge, while concentrated electrolytes, finite ion size and pore confinement can produce bell-shaped or double-peaked curves. Pseudocapacitance can add broad potential-dependent contributions near a redox transition. The sketch above therefore labels several possible behaviours instead of asserting a universal monotonic trend. Constant-potential simulations have directly found transitions between double-peaked and bell-shaped differential-capacitance curves as interfacial interactions change.[ref]
Porous carbon emphasizes power and cycle life. Activated carbon, graphene-derived structures and nanotubes can provide high accessible area, electronic conduction and relatively reversible double-layer charging. Cost and stability can be favourable. However, inaccessible micropores, tortuous ionic paths, poor packing density and surface functional groups can reduce useful rate performance or volumetric energy density. Area measured by gas adsorption is not automatically accessible to electrolyte ions.
Metal oxides can add substantial redox charge storage. A suitable oxide offers high pseudocapacitance, but its electronic conductivity, ion-transport distance and electrochemical stability can limit power. Some high-performing compositions are expensive or contain scarce elements. Structural changes and dissolution can shorten life. Conductive composites and thin active layers help, but adding inactive support dilutes device-level energy storage.
Conducting polymers combine redox activity with electronic conduction and flexible processing. Their oxidation state and counterion population change during charging. Repeated ion and solvent uptake causes swelling and shrinkage, which can crack or delaminate an electrode and shorten cycle life. Conductivity is also state-dependent, and potential windows are constrained by overoxidation or reduction. A practical comparison must include both electrodes, electrolyte, packaging and the usable voltage: makes voltage stability as important as a large gravimetric capacitance.
TODO — user-deferred biology. This part explicitly concerns virus-particle imaging. It is preserved in the numbering tree and left unsolved under the requested nonbiology scope.
TODO — user-deferred biology. This part explicitly concerns virus-particle imaging. It is preserved in the numbering tree and left unsolved under the requested nonbiology scope.
TODO — user-deferred biology. This part explicitly concerns virus-particle imaging. It is preserved in the numbering tree and left unsolved under the requested nonbiology scope.
TODO — user-deferred biology. This part explicitly concerns virus-particle imaging. It is preserved in the numbering tree and left unsolved under the requested nonbiology scope.
TODO — user-deferred biology. This part explicitly concerns virus-particle imaging. It is preserved in the numbering tree and left unsolved under the requested nonbiology scope.
TODO — user-deferred biology. This part explicitly concerns virus-particle imaging. It is preserved in the numbering tree and left unsolved under the requested nonbiology scope.
TODO — user-deferred biology. This part explicitly concerns virus-particle imaging. It is preserved in the numbering tree and left unsolved under the requested nonbiology scope.
TODO — user-deferred biology. This part explicitly concerns virus-particle imaging. It is preserved in the numbering tree and left unsolved under the requested nonbiology scope.
Use anisotropic alkaline wet etching of a suitably oriented crystalline silicon wafer. A KOH- or TMAH-based process etches crystallographic planes at different rates, leaving slow-etching facets as a pyramidal texture on a wafer. The facets redirect reflected light towards neighbouring surfaces, increasing the chance of absorption rather than specular escape.
Choose conditions that give a uniform texture without excessive removal or contamination, and clean the wafer before forming the junction. This mechanism depends on crystallinity: a multicrystalline or differently oriented wafer may need another texture process. The drawing alone does not establish the wafer orientation, so the standard pyramidal-texture method carries that explicit assumption.
Diffuse a donor such as phosphorus into the textured p-type surface, then control the thermal drive-in to form the shallow n-type emitter. A phosphorus-containing vapour source can supply the donor over the exposed area. Diffusion and activation create an n-on-p p-n junction; remove the phosphorus-rich surface glass and isolate the rear and wafer edges as required to avoid shunts.
An alternative is ion implantation followed by an activation and damage-repair anneal. The diffusion route is particularly convenient for large-area coverage of a textured wafer. The indicated roughly layer is a depth target for process control, not an instruction to grow an undoped film and assume that it becomes n-type.
Deposit hydrogenated silicon nitride by plasma-enhanced chemical vapor deposition. A plasma activates a silicon-containing precursor and a nitrogen source, enabling a conformal thin film at a lower substrate temperature than a purely thermal process. Tune gas composition, power and time to control thickness, refractive index, stress and hydrogen content.
The film serves as an antireflection coating and can also provide chemical and field-effect surface passivation. As a simple optical check, a quarter-wave thickness is ; and correspond to a design wavelength near . The textured surface and broadband illumination require a fuller optical optimization, so this check is an order-of-magnitude explanation rather than an exact reflectance calculation.
X is an aluminium-doped back surface field region. Annealing alloys the rear aluminium with silicon; on cooling, silicon regrowth adjacent to the contact incorporates aluminium as an acceptor. This creates a more heavily p-type region between the p-type base and rear metal contact.
The resulting doping gradient creates a field that reduces the minority-electron population near the recombination-active rear metal interface. It therefore reduces rear-surface recombination and improves collection of photogenerated carriers. Heavy doping also helps form a low-resistance majority-carrier contact. This is a rear isotype doping transition, not the front n–p junction and not an electrically insulating blocking layer.
In physical vapor deposition, material is physically released from a source and transported to the substrate, where it condenses. Three examples are thermal evaporative deposition, electron-beam evaporation and sputtering. Their angular distributions, source heating and energetic bombardment differ, even though all belong to the physical-deposition family.
In chemical vapor deposition, volatile reactants undergo chemical reactions that produce a solid film at or near the substrate, with gaseous products removed. Examples are atmospheric-pressure thermal CVD, low-pressure CVD and plasma-enhanced chemical vapor deposition. These are three established process variants, distinguished by pressure and activation method. Surface chemistry, precursor delivery and temperature determine growth, rather than condensation alone.
Atomic layer deposition is a related cyclic surface-reaction method, but need not be counted as a separate conventional CVD example to satisfy the requested three. Reactive sputtering can involve chemistry, so the boundary is best explained by the dominant source and transport mechanism rather than by claiming that a PVD chamber can contain no chemical reactions.
Choose conventional diode current as positive in forward bias. The ideal dark and illuminated current densities areThe dark reverse-bias asymptote is before breakdown. Illumination shifts the curve down by : the short-circuit point is , and the open-circuit point is . The power-generating region has positive voltage and negative diode-convention current. A plot using positive delivered current would flip the vertical sign; its physical intercepts are the same.
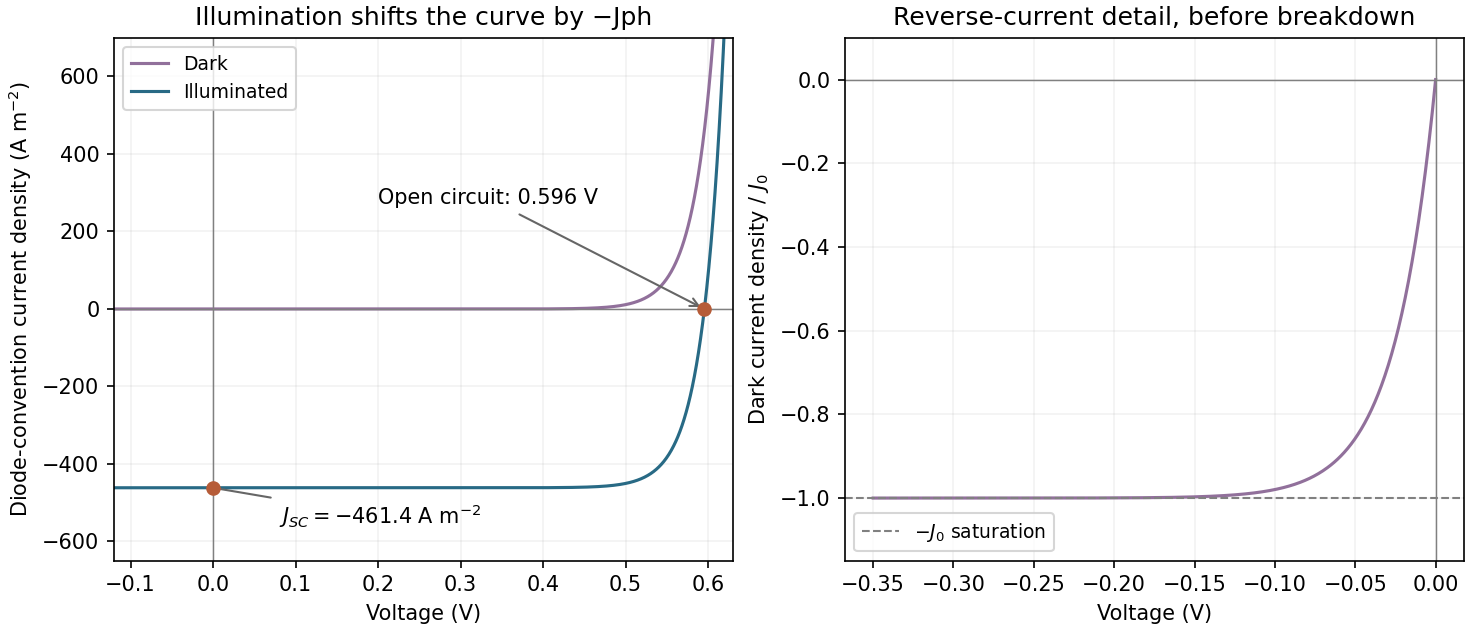

Assume one collected electron per absorbed photon, ideality factor one and . The question does not specify temperature, so the result should also be understood through its temperature-dependent formula. The photocurrent density isAt open circuit the diode current balances that photocurrent:Using gives approximately . These are current densities, so no device area is needed. Incomplete collection would replace by the collected current and reduce this estimate.
Without texturing, more incident photons generally escape by reflection, so the absorbed flux and decrease. Holding and temperature fixed, the voltage falls logarithmically: if absorption is multiplied by and , then . A real texture also changes surface area and recombination, so an unchanged is an assumption rather than a guarantee.
C2 is favoured by kinetic control; C1 is favoured by thermodynamic control. Starting from the central reactant well, the path towards C2 has the smaller activation barrier, so it normally forms faster at low temperature or short reaction time, assuming comparable prefactors. C1 lies lower in energy and is the more stable product on the drawn energy scale.
Raising temperature can make the larger barrier accessible and permit equilibration through reverse reactions. If products interconvert and entropy contributions do not reverse the energy ordering, the equilibrium mixture then favours C1. It would be incorrect to say that high temperature alone guarantees C1: an irreversible reaction may remain kinetically controlled, and the figure does not provide the full temperature-dependent free energies. The useful distinction is rate selection before equilibration versus relative free energy after equilibration.
Remove the gaseous coproduct as it forms, for example by a controlled inert-gas sweep or reduced pressure compatible with the solvent and apparatus. Lowering its partial pressure reduces its chemical potential. For the decomposition equilibrium,so removing G lowers the reaction quotient and drives net conversion towards F until equilibrium is re-established. As D is consumed, reversible conversion from E can replenish it, allowing the coupled network to feed F.
Removing or selectively precipitating F can have a similar effect if feasible. Heating may increase the rate, but its effect on equilibrium requires the reaction enthalpy; a catalyst accelerates equilibration without changing the equilibrium constant. The gas-removal argument works because it changes product activity, not because it changes the identity of the catalyst.
Articles were limited to the first 100 out of 142 total.
Articles by others on the same topic
There are currently no matching articles.