Polyglycolic-acid chain scission and mass loss are distinct changes: chain scission increases the number of shorter chains, while mass loss measures material leaving the specimen. Ester hydrolysis of polyglycolic acid can reduce chain length before the resulting fragments dissolve or detach.
An original mass balance model tracks retained repeat units and chain count . Ignoring end-group masses for this bookkeeping quantity, number-average degree of polymerization is . If distinct backbone bonds are cut without rings or fragment loss,Thus the chain-length change does not require any loss of repeat-unit mass. Hydrolysis also incorporates water into new end groups, so exact dry-mass accounting needs those chemical contributions in addition to this simplified count.
Take 1000 initial chains with 1000 repeat units each. There are one million retained units. After 9000 distinct cuts and no loss, there are 10000 chains with mean length 100 units, a tenfold reduction. The repeat-unit inventory is still unchanged. These counts are illustrative, not an assumed kinetic law.
Now suppose 2000 of the short fragments, each containing ten units, leave that specimen. The retained inventory becomes 980000 units in 8000 chains, giving mean length 122.5. Retained repeat-unit mass has fallen by 2%, yet the mean chain length of the survivors has increased from 100 to 122.5. Preferential removal of short fragments can produce this result without any broken chain healing.
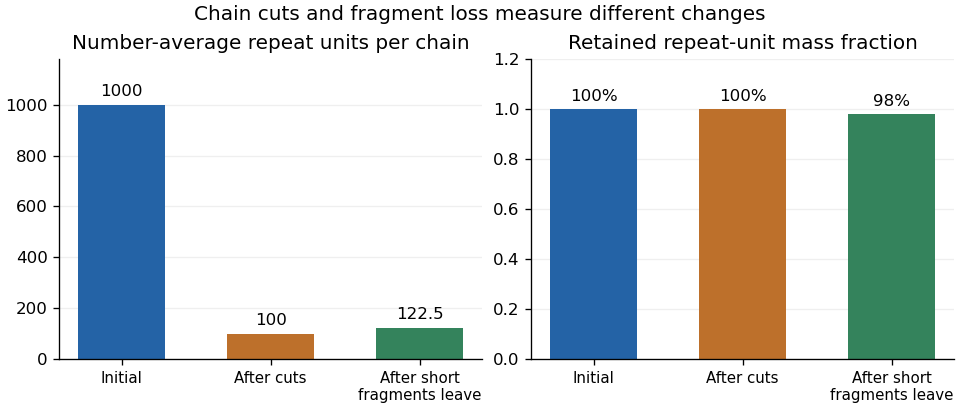
Original repeat-unit bookkeeping model: cuts shorten chains before mass leaves, and selective fragment loss changes the surviving mean
. Details. 
The manufacturer's degradation test measures filtered, dried material after timed water exposure at stated temperatures.[ref]
Kuredux Polyglycolic Acid Resin technical brochure by Kureha. PDF p. 3, Degradability test method and temperature-labelled curves
That result is a retained-residue observation. It does not directly count broken bonds or identify the molecular-mass distribution of material that escaped.A useful experiment combines such residue measurements with size-exclusion chromatography or another appropriate chain-length measurement, and separately accounts for soluble products where possible. The sampling and analytical method must specify whether it describes the whole material or only an extractable fraction. Selective-fragment-loss bias in polymer molar mass can otherwise make a surviving sample appear less degraded by one statistic even as mass is being lost.
Polymer erosion in the specific IUPAC terminology additionally requires surface-inward degradation; a mass-loss curve alone does not establish that spatial mechanism.[ref]
Terminology for biorelated polymers and applications (IUPAC Recommendations 2012) by Michel Vert and others. entry 70, erosion, printed p. 391
Keep chain length, retained mass and structural evidence distinct when interpreting a degradation study.Selective-fragment-loss bias in polymer molar mass arises when the chains retained or analyzed are not representative of the original molecular population. Preferential loss of short fragments can raise the measured number-average molar mass of the survivors even while the specimen loses mass and chain scission continues.
Let denote molar mass for a molecule drawn with equal probability from the original chain population. If its retention probability is , the number-average molar mass of retained chains isConsequentlyRetention favouring larger chains can make this difference positive. This is an original selection calculation; it does not assume a particular hydrolysis mechanism. If the intended measurand is explicitly the retained fraction, its correctly measured mean is not intrinsically erroneous. Bias appears when that mean is interpreted as the whole population's mean.
An original mixture has 90 chains at and ten at . Its number-average molar mass is . Removing all short chains leaves the survivor mean at 100, although only of the initial chain mass has left. The large numerical increase does not imply chain growth.
A weight-average molar mass is a different statistic: . The same initial mixture has , showing why an averaging convention must accompany a reported molecular-mass value. Equal molecule weighting and equal mass weighting answer different questions.
Experimentally, distinguish residue, released soluble fragments and the fraction actually injected into the analytical instrument. A polymer fraction-recovery balance can compare their recovered mass. The manufacturer's polyglycolic acid test measures filtered dry residue after water exposure; it does not directly supply the chain distribution in the liquid that passed through.[ref]
Size-exclusion chromatography adds a further measurement model: IUPAC defines its separation chiefly through hydrodynamic volume in a porous, non-adsorbing material, not molecular mass alone.[ref]
Size-exclusion chromatography in the IUPAC Gold Book. entry S05705, definition
Solubility, preparation losses, detector response and the mass calibration can therefore affect what distribution is inferred. Preserve the sampled fraction's identity instead of treating a cleaner chromatogram or a higher surviving mean as evidence that degradation reversed.A polymer fraction-recovery balance accounts for material recovered in each sampled fraction after a polymer experiment, including retained solids, dissolved products, filter deposits and container rinses. It tests whether the fractions used to infer a molar mass distribution represent the intended population. A decrease in retained mass and a change in the number-average molar mass of the analyzed fraction are different observations.
First specify a polymer recovery accounting basis. Comparable dry masses can be summed when they describe the same material inventory; chemical transformation may instead require a conserved-element or repeat-unit inventory. For example, ester hydrolysis incorporates water into new end groups. Summing product mass as though it were unchanged original polymer mass then mixes accounting conventions. The manufacturer's decomposition diagram for polyglycolic acid explicitly distinguishes hydrolytic decomposition from later microbial degradation.[ref]
Kuredux Polyglycolic Acid Resin technical brochure by Kureha. March 2022 brochure, PDF p. 2, decomposition diagram
For an original closed repeat-unit bookkeeping model with no destruction of those units, let be the initial inventory. WriteHere is recovery on that specified basis. Material converted into unmeasured chemical products belongs in the unaccounted inventory until measured; a recovery deficit alone does not identify its chemical fate.
On a stipulated consistent mass-equivalent basis, start with 100 mg and recover 70 mg in solids, 20 mg in the soluble fraction and 5 mg in rinses. Recovery is 95%, leaving 5 mg unaccounted. The 30 mg decrease in retained solids is not evidence that all 30 mg was collected as soluble material: only 20 mg was measured there. Experimental mass balance requires those distinctions even when a single residue curve appears smooth.
Combining recovered number-average molar masses also requires counting chains rather than averaging the reported means by mass. If fraction has mass and correctly measured number-average molar mass , its amount of substance of chains is . Thus, for the combined measured fractions,An original example recovers 80 mg with and 20 mg with . These correspond to and of chains. Their combined 100 mg divided by gives . The mass-weighted average of the two reported means, , is not their combined number-average molar mass. Missing fractions with unknown chain counts prevent this calculation from establishing the whole original population's mean.
A useful collection protocol measures initial material, retained residue, filtrate and rinses separately, with preparation blanks and stated drying conditions. Kureha's published water-exposure protocol measures filtered, dried solids, so that observable covers only one part of the balance.[ref] A size-exclusion chromatography trace of a selected fraction adds another measurement model: IUPAC defines that separation chiefly through hydrodynamic volume in porous non-adsorbing material.[ref]
Size-exclusion chromatography in the IUPAC Gold Book. entry S05705, definition
Recovery, representativeness and the conversion from separation to molar mass must all be justified before interpreting a survivor distribution as the full degraded sample.A polymer recovery accounting basis specifies the conserved inventory used to compare initial material with recovered fractions. Possible choices include conditioned dry mass, original repeat-unit equivalents or the amount of a particular element. These bases coincide only under suitable chemical and sampling assumptions. A polymer fraction-recovery balance needs that convention before its recovery percentage has a clear meaning.
For fractions with measured masses , suppose converts one unit of that product mass into the chosen original-material equivalent. Recovery on that basis iswhere is the initial inventory in the same units. Taking every is a chemical assumption: it requires that the measured masses are directly comparable. Different solvent contents, water incorporated by reaction, salts, fillers or filter residues can invalidate it.
An original polyglycolic acid example makes the distinction visible. Ignoring initial end-group contributions for a repeat-unit bookkeeping comparison, one millimole of repeat inventory represents approximately 58.04 mg. Complete ester hydrolysis to one millimole of glycolic acid, , gives approximately 76.05 mg. The roughly 18.01 mg difference comes from incorporated water, not extra recovered original repeat inventory. The manufacturer's structural and decomposition diagrams identify the polymer and hydrolysis product.[ref]
Kuredux Polyglycolic Acid Resin technical brochure by Kureha. March 2022 brochure, PDF p. 2, Molecular Structure and decomposition diagram
Dividing the product's 76.05 mg directly by 58.04 mg would report approximately 131.0% recovery on mixed bases. The monomer-to-original-repeat conversion is instead , restoring 58.04 mg of original repeat equivalents. Exact finite-chain accounting must include the original end groups and count hydrolyzed bonds; the repeat-unit example deliberately omits that small-chain correction. Soluble oligomers contain a different number of end groups per repeat, so the monomer conversion is not universal for an unidentified soluble mixture.
Carbon-basis closure for polymer degradation offers another explicit inventory. Each repeat and each glycolic-acid molecule has two carbon atoms, so the example contains approximately 24.02 mg of carbon before and after the specified hydrolysis. If subsequent chemistry produces other carbon-containing products, those products belong in that inventory too. Carbon introduced by solvent or background contamination must be distinguished from specimen carbon; otherwise elemental closure can look satisfactory for the wrong reason.
An original fraction count begins with 1.00 mmol of repeat equivalents and recovers 0.60 mmol in the solid, 0.30 mmol in identified soluble material and 0.05 mmol in rinses. Recovery is 95%, regardless of whether the corresponding product masses differ through hydration. The remaining 0.05 mmol is unaccounted on this basis; the deficit alone does not establish whether it was chemically transformed, escaped collection or was underestimated analytically.
A useful experiment records conditioning and drying, collects filtrate and rinses, identifies the soluble products and measures blanks. Kureha's published test uses filtered, dried residue after timed exposure of material at 2% solids concentration to deionized water.[ref] That retained-residue mass is one well-defined observable. Inferring the full chemical recovery requires the other fractions and their conversion factors. Report those assumptions separately from the molar mass distribution of whichever fraction was analyzed.
Carbon-basis closure for polymer degradation compares the amount of carbon initially introduced in a polymer with the carbon recovered in all measured products and residues. It avoids confusing incorporated water with recovered original polymer mass, while requiring dissolved and gaseous products to be counted as well as retained solids.
On a consistent specimen-carbon basis, writeThe measured recovery is the sum of the first four terms divided by . Specify whether each denotes carbon mass or amount of substance; numerator and denominator must use the same units. Carbon from medium, inoculum, solvent or contamination must be separated from specimen-derived carbon.
An original polyglycolic acid example begins with one millimole of repeat-unit inventory, containing two millimoles of carbon atoms, approximately 24.02 mg of carbon. Hydrolysis to one millimole of glycolic acid preserves those carbon atoms while incorporating water. The product's larger total mass is therefore not extra carbon recovery. The manufacturer's repeat structure and decomposition diagram identify that chemical relationship.[ref]
Kuredux Polyglycolic Acid Resin technical brochure by Kureha. PDF p. 2, Molecular Structure and decomposition diagram
If some products become carbon dioxide, convert measured gas mass to carbon mass before adding it to residue carbon:For an illustrative initial 24 mg of carbon, suppose corrected measurements recover 12 mg in solid, 6 mg dissolved and approximately 3 mg in carbon dioxide. Recovery is , leaving 3 mg unaccounted. Approximately 11 mg of carbon dioxide contains 3 mg of carbon; adding that full gas mass to solid and dissolved carbon would mix bases.
A concrete primary apparatus is the OECD 301 B carbon-dioxide evolution test. It aerates inoculated mineral medium with carbon-dioxide-free air at a controlled rate, traps evolved gas in barium or sodium hydroxide, and determines it by titration or inorganic-carbon measurement. Blank inoculum contributions are subtracted.[ref] These operations explain why inlet scrubbing, gas collection and blank correction belong to the measurement rather than being optional bookkeeping.
The guideline is a chemical biodegradability test, not proof that every polymer shape or formulation meets its applicability conditions. Its general section requires attention to solubility, volatility, adsorption and composition.[ref]
Test No. 301: Ready Biodegradability by OECD. General procedures, §§7–9
Use those conditions when adapting a collection experiment to a particular specimen.Blank-corrected carbon recovery in polymer tests also needs uncertainty in the background subtraction. Carbon missing from the liquid can have moved to surfaces or gas without being completely converted to carbon dioxide. Conversely, carbon dioxide production establishes conversion of some carbon but does not measure the remaining chain-length distribution. Report closure, identified chemical products and the molar mass distribution as different results; a successful elemental balance alone does not determine the degradation mechanism.
Blank-corrected carbon recovery in polymer tests subtracts measured background carbon from a specimen-containing experiment before comparing recovered carbon with the specimen's initial inventory. It is a carbon-basis closure for polymer degradation calculation with an explicit background model. Uncertainty in that subtraction and differences between blank and specimen conditions both affect the result.
For total measured carbon , mean blank carbon and initial specimen carbon , writeAll terms must use the same carbon-mass or carbon-amount basis. For independent and , ; a shared correction can instead introduce covariance. Uncertainty in also enters the recovery ratio. The GUM's correlated-input rule supplies the general propagation framework.[ref]
An original numerical example measures mg of carbon, with standard uncertainty 0.5 mg. Three independent blank runs give 2, 4 and 6 mg. Their mean is 4 mg, sample standard deviation is 2 mg and estimated standard uncertainty of the mean is mg. Net carbon is therefore 6 mg with standard uncertaintyWith stipulated exact mg, recovery is 25%, with standard uncertainty approximately 5.24 percentage points. A precise total measurement can still leave a relatively uncertain net result after subtraction.
Shared-blank covariance in carbon recovery matters if the same estimated blank corrects several specimens. With independent specimen totals , each corrected quantity is , soFor four specimen totals each having the 0.5 mg standard uncertainty above, averaging the corrected values gives variance . Treating all four corrected values as independent would incorrectly divide the shared blank contribution by four. Taking more specimen readings does not recreate independent blank information.
The OECD 301 B apparatus aerates inoculated medium with carbon-dioxide-free air and measures evolved gas captured in hydroxide traps. Its measured carbon dioxide is corrected for blank inoculum production.[ref] Use matched collection duration, volume and analytical conversion when comparing blanks and specimen vessels; a gas-mass reading must be converted to carbon mass before mixing it with other carbon fractions.
A blank is not guaranteed to reproduce every background process inside the treated vessel. The guideline explicitly notes that endogenous activity in the presence of the test chemical may differ from that in the blank control.[ref] Replication estimates scatter around the blank model; it does not prove additivity. Report the blank design, correction, uncertainty and any evidence for altered background activity alongside the final recovery.
Blank-allocation design for carbon recovery chooses how many specimen and blank measurements to make under a stated cost and uncertainty model. Because a shared blank affects all corrected results, additional specimen readings alone can leave the dominant uncertainty unchanged. The design objective should explicitly include the blank estimate.
For independent specimen totals with individual standard deviation and blanks with standard deviation , estimate a net mean by . Its variance isLet each specimen measurement cost and each blank cost , with budget . An original continuous optimization using a Lagrange multiplier givesThese formulas assume positive counts, independent observations and known planning variances. Integer counts and minimum replication constraints still require checking.
For stipulated mg, mg, specimen cost 3 minutes, blank cost 1 minute and budget 60 minutes, a feasible design uses nine specimen measurements and thirty-three blanks. It costs exactly 60 minutes and gives variance . Eighteen specimen measurements and six blanks also fit the budget but give approximately . The more specimen-heavy design is less precise in this model.
The optimization concerns precision, not proof that background subtraction is unbiased. OECD's carbon-dioxide evolution method uses inoculum blanks, while its general principles note that endogenous activity with the test chemical may differ from the blank control.[ref] More blanks estimate their own mean more precisely without establishing perfect additivity.
Batch-specific blank allocation is important when preparation day, medium or collection time changes the background. Pooling all blanks into one common estimate can be inappropriate if the specimen groups do not share that background. Conversely, treating one reused blank estimate as independent for every specimen discards the shared-blank covariance in carbon recovery.
A practical planning study therefore records the independent experimental unit, actual preparation costs, temporal grouping and pilot variance uncertainty. The GUM's treatment of correlated inputs supplies the framework for retaining common corrections.[ref] Evaluate feasible designs under plausible alternative variance components rather than reporting a continuous optimum as a universal replication requirement.
Batch-specific blank allocation assigns background controls to the specimen groups whose preparation conditions they actually represent. In an experiment on blank-corrected carbon recovery in polymer tests, a batch may share inoculum, medium, collection time or reagent preparation. A precisely measured blank from another batch can still be the wrong correction. OECD's test framework uses parallel inoculum controls and warns that endogenous activity with a test substance need not equal the control's activity.[ref]
For an original independent-batch model, estimate a weighted net mean byThe weights specify the scientific target; they are not automatically the observed fractions of specimens. Within a batch, reusing its blank estimate creates the shared-blank covariance in carbon recovery. Common corrections across batches require additional covariance terms rather than the independence assumed here.[ref]
If specimen counts are fixed and each blank costs the same, minimizing the remaining variance under a total blank-count budget gives . Consider two batches with weights , ten specimen readings each, specimen standard deviation 1 mg, blank standard deviation 2 mg and twelve blank readings available. Ten blanks in the first batch and two in the second give variance . Splitting blanks six and six gives approximately . These stipulated numbers illustrate allocation; integer and minimum-replication constraints still apply.
Batch-matched blank weighting also controls bias. If batch backgrounds are 1 and 5 mg, their scientifically weighted background is mg. Subtracting an equally pooled blank mean of 3 mg instead biases that weighted net result downward by 1.2 mg. Extra replication of the pooled estimate does not remove this mismatch.
Record batch membership and independent preparations before deciding which blanks to pool. Allocation can reduce sampling variance; it cannot prove that a background correction is chemically additive.
Batch-matched blank weighting applies background corrections in the same proportions as the specimen results they correct. It concerns the definition of the target mean as well as the precision of the blank measurements. An experiment on blank-corrected carbon recovery in polymer tests can have different backgrounds across preparation batches even when every batch follows the same nominal procedure.
For an original additive model, let be a batch specimen mean and its blank mean, with zero-mean measurement errors. The desired scientific target is , where . If specimen means use but blanks use different weights , the estimatorhas bias . Matching removes that bias for arbitrary batch backgrounds in this model. Pooling can remain unbiased under an additional justified common-background assumption, but that is a different model.
For stipulated backgrounds 2 and 8 mg and target weights 0.75 and 0.25, the relevant correction is 3.5 mg. An equally weighted pooled correction is 5 mg and biases the net mean downward by 1.5 mg. Dividing that net result by a fixed 50 mg initial-carbon amount shifts the recovery fraction by , or three percentage points. These are constructed examples, not OECD test results.
With independent specimen and blank estimates, variance propagation gives . Common reference measurements require covariance terms as well.[ref]
Guide to the expression of uncertainty in measurement by JCGM. §5.2.2, equation 13; §5.2.4, shared instruments and corrections
Changing weights to reduce variance can change the target or introduce bias; it is not automatically an improvement.Transporting blank corrections between batches requires evidence that their backgrounds are exchangeable for the intended correction. OECD's general principle already cautions that endogenous activity with a test chemical need not match the inoculum control.[ref] Matching batch weights repairs an aggregation error; it does not establish chemical additivity. State the target population, batch labels, normalization amounts and pooling assumptions before deciding which measurements share a correction.
Transporting blank corrections between batches uses background measurements from one preparation or acquisition group to correct another. The transfer requires a justified relation between their backgrounds; sharing a nominal protocol does not by itself establish equality. In blank-corrected carbon recovery in polymer tests, OECD's general principle warns that endogenous activity with a test substance need not match its blank control.[ref]
An original additive model writes a target specimen reading as and a source-batch blank as . Let . A transferred correction isIgnoring the shift biases the result by . For stipulated specimen reading 18 mg, source background 2 mg and target background 5 mg, direct source-blank subtraction gives 16 mg instead of 13 mg. A precisely measured source blank does not eliminate this three-milligram mismatch.
Transfer uncertainty must also be retained. Under independent errors with standard uncertainties mg, mg and mg, the corrected result has uncertainty mg. Omitting the transfer term gives only 1.12 mg. These chosen values illustrate the measurement model, not observed test performance. The GUM requires significant correction and influence quantities to be included rather than treating the functional relationship as just a numerical formula.[ref]
Shared-reference cancellation in transferred blank corrections is a complementary warning. If the estimated shift is literally , then . The source blank cancels. Treating and this shift as independent would double-count uncertainty; their covariance contains the cancellation.[ref]
A transfer study can pair blanks across preparation conditions, quantify a reproducible shift and test whether it depends on collection time or material. Such evidence supports a specified transfer model. It does not prove that a blank remains chemically additive in the presence of the specimen.
Reference identity in algebraic uncertainty cancellation asks whether two appearances of a reference are the same measured quantity or merely readings given the same descriptive name. If a transfer is but a correction subtracts , thenThe last difference vanishes identically only when the same reference value is reused. Separate acquisitions may be correlated, independent, or affected by drift; sharing a label does not decide their covariance.
For independent and , also independent of the reference pair, propagation givesWith equal reference standard uncertainties and correlation coefficient , the residual reference contribution is . It is zero for identical reused values, for independent readings, and is not generally zero just because the displayed numbers agree. The GUM requires significant correlations from common inputs to be included.[ref]
An original acquisition model separates what cancels:Here is a common uncertain calibration contribution, while are independent repeat errors. Their difference removes both and , but leaves . If mg and each repeat error has standard deviation 2 mg, each reading has variance and their covariance is . The difference therefore has variance , not zero.
Adding independent mg and mg gives . Reusing exactly one recorded reference value in both places instead gives . These constructed cases have different data-reduction histories despite similar-looking equations.
Reference lineage in covariance models records acquisition identifiers, shared calibration inputs and coefficients in each derived quantity. A calibration change or time-dependent drift must appear in that model if significant. Algebraic simplification is valuable only when it preserves the identity of the underlying inputs; renaming two acquisitions with the same symbol does not make their errors cancel.
Reference lineage in covariance models records which primitive observations and calibration quantities enter each derived measurement, with what coefficients. Two inputs can share the same reference yet respond to it differently. A shared name alone therefore does not establish either equal errors or exact cancellation.
For a linear measurement model, collect primitive inputs in , derived inputs in and their covariance matrices in . ThensoThe matrix records the data lineage as well as the algebra. This implements the GUM approach of expressing correlated quantities in terms of their common inputs.[ref]
An original example uses independent inputs with variances , respectively. Let two reference readings be and . Correct a specimen by . Substitution givesThe shared does not cancel, because its sensitivities are one and two. Equivalently, , and in squared milligrams. Their difference has variance , giving the same total 27. Treating the reference readings as independent would incorrectly give 63 for the total variance.
If both readings instead contained with coefficient one, that shared contribution would cancel and the total would be 18 in the same units. These are different acquisition models, not two uncertainty conventions for the same data.
A usable lineage record therefore includes acquisition identifiers, calibration versions, reuse of numerical values and sensitivity coefficients. For nonlinear data reduction, a local sensitivity matrix replaces the linear when first-order propagation is justified. Covariance must follow the actual reuse and dependence structure; assigning independence because derived columns have different labels can discard the information needed for correct cancellation.
Articles by others on the same topic
There are currently no matching articles.