Size-exclusion chromatography separates dissolved molecules by their hydrodynamic size in the chosen solvent. A larger species that cannot enter the packing's pores travels with the liquid between particles and elutes earlier. Smaller species explore more internal liquid and elute later. The column is not a sieve that permanently traps the large species: exclusion makes them leave first. “Gel filtration” is common for aqueous separations; “gel permeation chromatography” is common for organic-solvent analysis of polymers. SEC molar mass calibration translates size-dependent elution into a standard-relative estimate of molar mass, rather than a universal absolute measurement.
This makes SEC useful for separating proteins from small dissolved species, comparing protein aggregation, and characterizing dissolved polymer chains. The residual-group monitoring of polyurethane formation experiment already illustrates polymer calibration: its reported molar masses are relative to polystyrene standards. Size-exclusion characterization of chain polymers explains why an elution trace alone cannot count chains or establish their growth mechanism.
In ideal SEC pore access, geometric exclusion changes the fraction of pore liquid a solute can occupy. Diffusion permits entry into and exit from accessible pores; the through-flow chiefly transports the sample between packing particles. A hydrodynamic radius is a useful size descriptor, but actual pore entry also depends on shape and pore geometry. A flexible polymer coil is not a rigid ball with a perfectly sharp entry diameter.
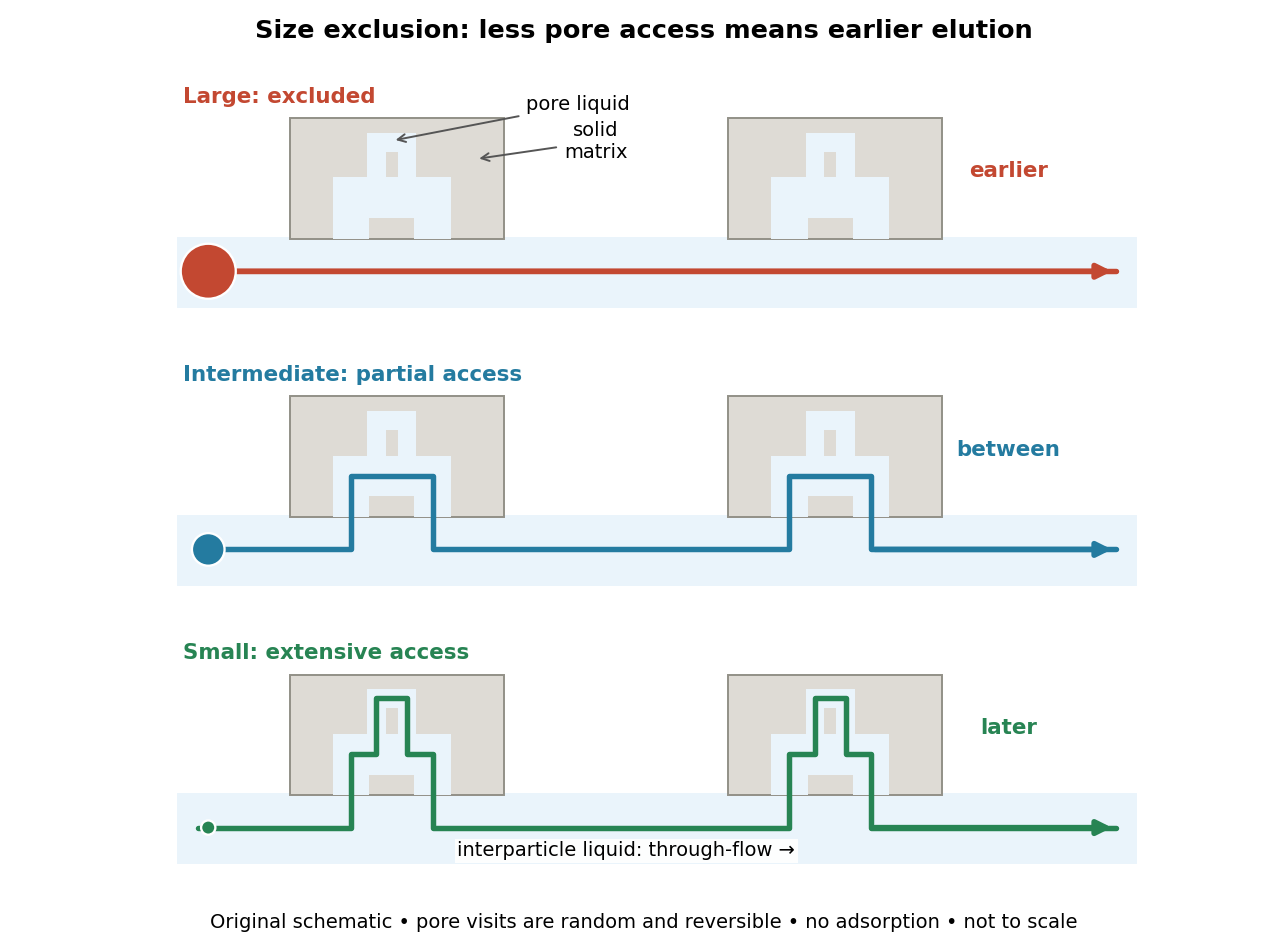
The extra delay is best understood as extra accessible storage, rather than a prescribed longer streamline. Pore visits are reversible and random. An entirely excluded species samples the SEC void volume; a sufficiently small nonbinding species samples the SEC total accessible liquid volume. Intermediate species lie between these limits. Larger hydrodynamic size generally means earlier elution within the column's SEC fractionation range.
The SEC void volume is the interparticle liquid volume, operationally measured by a sufficiently large excluded, nonbinding tracer. It excludes pore liquid. Choose a tracer that does not undergo adsorption or change the packing; correct the measured elution for tubing and detector delay before identifying it with a column-only .
The SEC total accessible liquid volume is : interparticle plus pore liquid. A fully included nonbinding tracer estimates it. Geometric bed volume instead includes solid matrix, .[ref]
Size Exclusion Chromatography: Principles and Methods by GE Healthcare. GE Healthcare, Size Exclusion Chromatography: Principles and Methods, revision 18102218 AM, printed pp. 15–16, Figure 1.7: liquid, pore and geometric volumes
For ideal SEC, define the SEC partition coefficient byHere averages solute concentration over all pore liquid, including inaccessible regions. is column elution volume. Pure steric exclusion gives ; the endpoints mean exclusion and full access.[ref]
Size Exclusion Chromatography: Principles and Methods by GE Healthcare. GE Healthcare, Size Exclusion Chromatography: Principles and Methods, printed pp. 15–16: concentration-ratio definition and Kd limits
A storage argument explains the relation. Assume a dilute stable solute, unchanged packing and solvent, constant volumetric flow rate , rapid local chemical equilibrium between pore liquid and interparticle liquid, negligible binding, and negligible transport through the pores by bulk flow. At interparticle concentration , the column holds an amount of substance . Its exit transports per unit time. The ratio is the mean residence time in this equilibrium transport model; multiplying by gives . For a narrow symmetric SEC chromatogram peak, the peak maximum approximates that mean; a strongly asymmetric peak needs an explicitly stated location convention.
The handbook also uses an operational normalizationThis denominator includes solid matrix, so full access gives when . It differs from the pore-liquid SEC partition coefficient. Read each source's volume convention before comparing coefficients.[ref]
Size Exclusion Chromatography: Principles and Methods by GE Healthcare. GE Healthcare, Size Exclusion Chromatography: Principles and Methods, printed p. 16, Figure 1.8: Kav uses Vc, not Vt
For an original numerical example, take , , and . Then and . Elution at gives but . Even a fully included tracer gives , not . These are stipulated volumes, not experimental measurements.
The SEC fractionation range has differential SEC pore access. Larger excluded species share ; fully included species share . Neither group can be size-ranked by elution. A broader pore distribution can trade separation per size increment for range.[ref]
Size Exclusion Chromatography: Principles and Methods by GE Healthcare. GE Healthcare, Size Exclusion Chromatography: Principles and Methods, printed pp. 17–18, Figures 1.9–1.10: selectivity curves, fractionation and exclusion limits
SEC molar mass calibration measures standards under the same column, solvent, and temperature conditions as the unknown. Over a suitable fractionation interval, a common empirical approximation iswhere specifies the molar mass unit and has inverse-volume units. Interpolation is conditional on the standards' size–molar mass relationship. SEC measures access associated with hydrodynamic size, so a branched polymer, an extended chain, and a compact protein need not share that relationship.
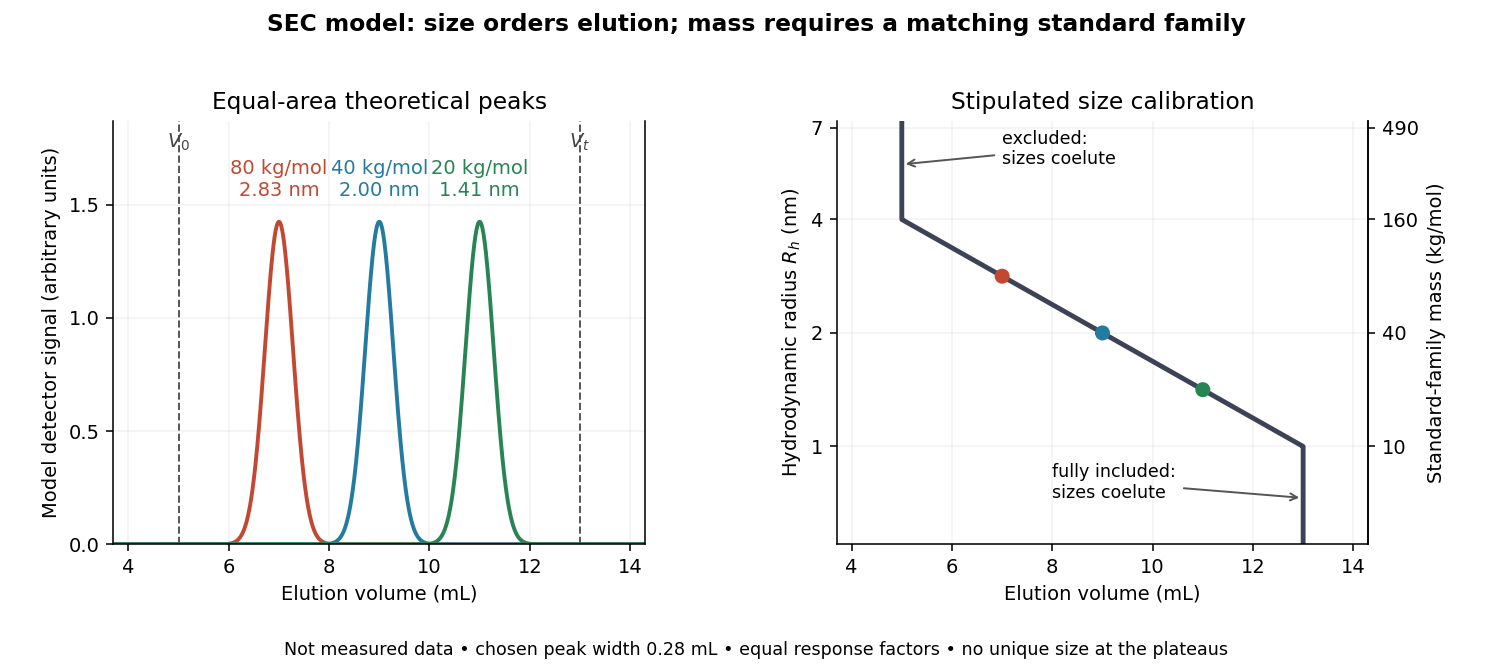
In this model the , , and standards have hydrodynamic radii , , and and elute at , , and . An unknown at would be assigned by this calibration. But a species that expands from to elutes at and is assigned without gaining any mass. The numbers demonstrate ambiguity, rather than predict a real unfolding transition.
Changes in conformational isomerism, protein folding, protein denaturation, and protein aggregation can therefore shift peaks. Association usually increases size; compaction can reduce size at unchanged molar mass. Adsorption creates a different ambiguity: delayed elution need not indicate a smaller species. A different solvent can change both polymer coil dimensions and interactions with the packing. The SEC protein conformation experiment tests these alternatives with additional detectors.
A SEC chromatogram plots a detector signal against elapsed time or elution volume. At constant volumetric flow rate , the volume delivered after injection is ; subtraction of extra-column transport volume is needed for a column-only . Real peak widths include injection volume, column dispersion, and tubing/detector spreading. Peak position, width, and area answer different questions.
A SEC detector response must be specified before interpreting a peak area. Ultraviolet absorbance depends on a species' response factor and concentration, as described by the Beer-Lambert law; differential refractive index detection depends on how the dissolved species changes refractive index. Equal amounts need not produce equal signal areas across unlike species.
Even a calibrated mass-proportional trace is not a chain-count probability distribution. In an original two-population example, equal recovered masses of chains with molar masses and contain four times as many chains in the lighter population. Thus equal signal areas, assuming equal response per unit mass, correspond to number fractions and : their number-average molar mass is , while their weight-average molar mass is . Converting a continuous trace additionally requires response correction and the appropriate change of variables between elution and molar mass bins.
SEC light-scattering detection adds information from scattering of light to the separation. Static scattering with a concentration readout can infer a weight-average molar mass for material in an eluting slice without the standard-family retention calibration. Dynamic scattering estimates a diffusion coefficient and hence a hydrodynamic radius. “Absolute” here means independent of a retention-to-molar mass standard curve; it still needs calibrated detectors, optical response parameters, and a valid sample model. Coeluting species produce a mixture-weighted result, rather than individually identified molecules.
A concrete manufacturer test used a Bio SEC-3 column, with particles, an Agilent 1260 Infinity G5611A quaternary pump and G5667A autosampler, a diode-array flow cell, and dual-angle/dynamic scattering detectors. A buffer solution at pH flowed at ; column and scattering detector were at . Absorbance at supplied a concentration-sensitive readout. Dilution and loading comparisons tested response: seventeen ovalbumin injections spanning – gave a reported average with relative standard deviation. The note reports poorer separation of thyroglobulin from aggregates and an elevated mass estimate, illustrating the coelution limit. Its sample filtration also limits interpretation of larger protein aggregation products removed before injection.[ref]
Determination of Protein Molecular Weight and Size Using the Agilent 1260 Infinity Multi-Detector Bio-SEC Solution with Advanced Light Scattering Detection by Sonja Schneider. Sonja Schneider, Determination of Protein Molecular Weight and Size Using the Agilent 1260 Infinity Multi-Detector Bio-SEC Solution with Advanced Light Scattering Detection, 5991-3955EN, printed pp. 2–4: apparatus, Table 1, Figure 2 and Table 3
An authored manufacturer experiment used an Agilent 1260 Infinity Bio-inert Quaternary LC with Bio SEC-3 columns, diameter and or length. Four pump channels mixed water, sodium chloride, and two phosphate solutions into phosphate at pH , varying salt from to . At and , the readouts were diode-array absorbance, differential refractive index, and scattering at and . A supplied protein standard mixture calibrated retention; bovine serum albumin calibrated scattering constants and inter-detector delay. Increasing salt improved separation of two α-chymotrypsinogen A peaks; two columns also resolved peaks that one column did not. At salt, the two scattering-derived estimates were about and . The author inferred a possible size-changing conformation difference, rather than doubling of molar mass. The same poster shows delayed, tailing lysozyme peaks from unwanted interactions.[ref]
Size Exclusion Chromatography of Biomolecules – Detector Combinations to Obtain Maximum Information with Minimum Effort by Andrew Coffey. Andrew Coffey, Size Exclusion Chromatography of Biomolecules – Detector Combinations to Obtain Maximum Information with Minimum Effort, HPLC 2013, poster 901: Experimental; Figures 3–7; Table 1
The salt comparison and the independent mass readout constrain interpretation, but do not uniquely prove a particular protein structure. Salt can change protein folding, protein aggregation, and packing interactions together. In ideal SEC there is no adsorption; attraction from the hydrophobic effect or forces described by electrostatics can cause additional retention, tailing, and loss of recovered sample. Repulsion can instead reduce pore entry. A peak beyond contradicts the simple nonbinding model, rather than extending its size calibration.
Useful proposed controls compare a solvent blank, fresh calibration standards bracketing the sample, several injection amounts and volumes, and recovered sample quantity with injected quantity using an appropriately calibrated detector. Keep temperature and volumetric flow rate fixed while testing pH or ionic strength. Compare an independent mass readout before declaring an early peak an aggregate. Loss of an insoluble species during filtration, on-column association or dissociation, overloading, and broad unresolved peaks can all hide the original sample population. These are interpretation checks and limitations, not measurements invented for the figures.
Articles by others on the same topic



Size-exclusion chromatography (SEC), also known as gel filtration chromatography, is a separation technique used in biochemistry and analytical chemistry to separate molecules based on their size and shape. In this method, a porous gel or resin is used as the stationary phase, allowing smaller molecules to diffuse into the pores while larger molecules are excluded from entering them. This difference allows for the separation of components in a mixture as they pass through the column.