The Exner function, often denoted as \( \psi \), is a scalar function used in the field of fluid mechanics, especially in the study of rivers, lakes, and other open channel flows. It is particularly important in understanding sediment transport and the dynamics of riverbed profiles. In the context of sediment transport, the Exner function describes the change in elevation of the sediment bed over time as a function of sediment supply, transport capacity, and the flow conditions.
"METRIC" can refer to different concepts depending on the context. Here are some of the most common interpretations: 1. **Measurement System**: In the context of measurement, METRIC typically refers to the metric system, a decimal-based system of measurement that is used internationally. It includes units such as meters for length, kilograms for mass, and liters for volume.
TOMCAT and SLIMCAT are tools used in the field of mobile radio communications, particularly in scenarios involving the design and analysis of mobile communication systems. ### TOMCAT TOMCAT (Tool for Modeling and Analysis of Communication Antennas and Transmissions) is typically a software tool or framework that assists in modeling and simulating various aspects of communication systems, focusing on antenna characteristics and transmission parameters.
Tropical cyclone forecasting refers to the process of predicting the formation, intensification, movement, and overall behavior of tropical cyclones, which include hurricanes and typhoons depending on their region. This forecasting plays a crucial role in disaster preparedness and response, as these storms can cause significant damage due to high winds, heavy rainfall, and storm surges.
The term "Unified Model" can refer to a few different concepts depending on the context. Here are a couple of prominent meanings: 1. **Unified Modeling Language (UML):** This is a standardized modeling language used in software engineering and systems design that provides a way to visualize system design. UML encompasses various diagrams and notations that aid in specifying, visualizing, and documenting the artifacts of software systems. It's widely used for software architecture, design, and documentation.
Hydrology software refers to computer applications designed to simulate, analyze, and manage various aspects of water in the environment. This software is used by hydrologists, environmental engineers, water resource managers, and researchers to study hydrological processes, such as precipitation, evaporation, infiltration, surface runoff, groundwater flow, and watershed management.
QDA software refers to qualitative data analysis software designed to assist researchers and analysts in organizing, analyzing, and interpreting qualitative data. This type of software is commonly used in social sciences, humanities, market research, and other fields where open-ended responses, interviews, focus groups, and textual data need to be examined. Key features of QDA software generally include: 1. **Coding**: Users can assign codes to segments of text or data, allowing for systematic categorization and retrieval of data.
Amira is a software platform used primarily for visualization, analysis, and interpretation of scientific data, particularly in the fields of life sciences, bioinformatics, and medical imaging. Developed by Thermo Fisher Scientific, Amira provides tools for processing and visualizing complex data sets, including 3D and 4D images derived from various imaging modalities such as microscopy, MRI, and CT.
CP2K is a versatile software package designed for performing atomistic simulations of solid-state, liquid, molecular, and biological systems. It is primarily used for quantum mechanics and molecular dynamics simulations and can handle a variety of computational techniques, including: 1. **Density Functional Theory (DFT)**: CP2K can perform DFT calculations using various functionals and pseudopotentials.
Molecular design software refers to computational tools and applications used to model, design, and analyze molecular structures and their properties. These programs are widely used in fields such as chemistry, biochemistry, materials science, and drug design. The software can aid in the visualization of molecular structures, predict the behavior of molecules, simulate chemical reactions, and assist in the design of new molecules with specific characteristics.
R is a programming language and free software environment primarily used for statistical computing, data analysis, and graphical representation of data. Developed in the early 1990s by Ross Ihaka and Robert Gentleman at the University of Auckland, New Zealand, R has become a popular tool among statisticians, data scientists, and researchers due to its powerful capabilities and extensibility.
Seismic Handler is a software application used in seismology for processing, visualizing, and analyzing seismic data. It is designed to handle data from various sources, such as seismic networks, and provides tools for real-time monitoring, event detection, and data management. Key features of Seismic Handler typically include: 1. **Data Acquisition and Processing**: It allows for the collection and processing of seismic waveforms, enabling users to filter, transform, and enhance the data as needed.
Computational social scientists are researchers who use computational methods and tools to analyze social phenomena. This interdisciplinary field combines social science disciplines, such as sociology, psychology, political science, and anthropology, with computational techniques and data analysis to study human behavior, social interactions, and complex social systems.
Jacqueline Chen could refer to different individuals, but without additional context, it's difficult to specify which one you mean. If you're referring to a specific person, such as a public figure, researcher, or artist, please provide more details.
Virtual globes are interactive 3D representations of the Earth, typically using satellite imagery and data to create a digital model that users can explore. They allow users to view geographical information and features such as terrain, landmarks, and cities from various angles and zoom levels. Some of the key features of virtual globes include: 1. **3D Visualization**: Users can rotate and tilt the view to see the Earth from different perspectives, enhancing the understanding of geographical features.
Cadec-online.com is a website associated with Cadec Global, Inc., which specializes in providing technology solutions, notably in the field of fleet management and transportation. Cadec offers software and services that enhance the efficiency and effectiveness of fleet operations by providing tools for tracking vehicles, managing driver performance, optimizing routes, and ensuring compliance with regulations.
The FEniCS Project is an open-source computing platform aimed at solving partial differential equations (PDEs) using finite element methods (FEM). It provides a comprehensive toolkit for automating the solution of complex mathematical problems characterized by PDEs, which are prevalent in fields such as engineering, physics, and finance.
MOOSE (Multiphysics Object-Oriented Simulation Environment) is an open-source software framework designed for the development of simulation applications in various fields of scientific computing, particularly in multiphysics problems. It is primarily used for finite element analysis and allows users to simulate complex physical systems and processes by combining multiple physical phenomena such as heat transfer, mechanics, fluid dynamics, and chemical reactions.
Vensim is a software tool used for system dynamics modeling, which is a method for understanding and simulating complex systems over time. It allows users to create models that depict how various components of a system interact with each other through feedback loops and other dynamic processes. Key features of Vensim include: 1. **Modeling Capabilities**: Users can build stock and flow diagrams, which visually represent the quantities (stocks) and rates of change (flows) in a system.
Flow visualization is a technique used to study and understand the behavior of fluid flows, whether they are liquids or gases. It involves creating visual representations of fluid motion, which can reveal patterns, structures, and dynamics that might not be easily observable otherwise. Flow visualization can be applied in various fields, including engineering, meteorology, oceanography, and biomedical research.

Pinned article: Introduction to the OurBigBook Project

Welcome to the OurBigBook Project! Our goal is to create the perfect publishing platform for STEM subjects, and get university-level students to write the best free STEM tutorials ever.
Everyone is welcome to create an account and play with the site: ourbigbook.com/go/register. We belive that students themselves can write amazing tutorials, but teachers are welcome too. You can write about anything you want, it doesn't have to be STEM or even educational. Silly test content is very welcome and you won't be penalized in any way. Just keep it legal!
We have two killer features:
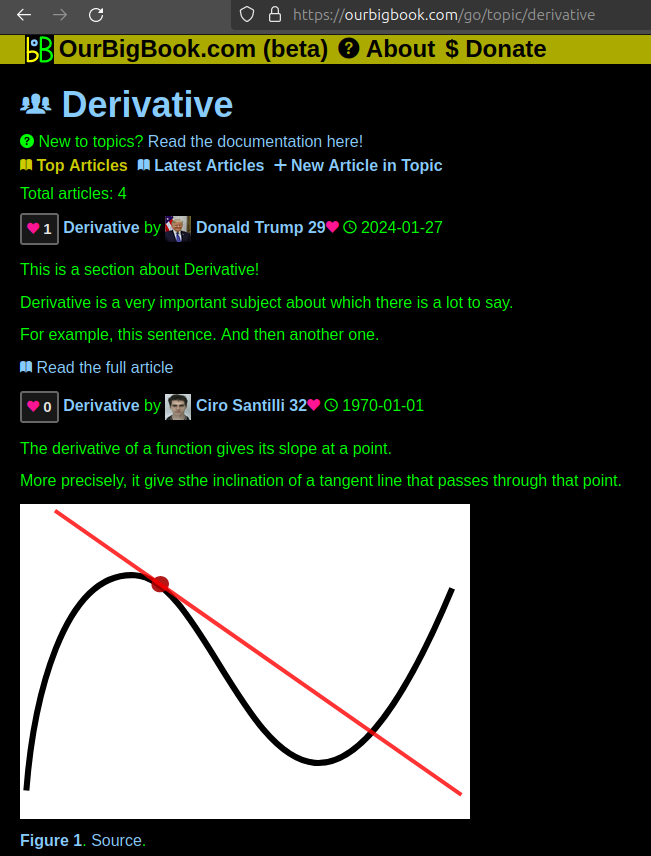
  1. topics: topics group articles by different users with the same title, e.g. here is the topic for the "Fundamental Theorem of Calculus" ourbigbook.com/go/topic/fundamental-theorem-of-calculus
    Articles of different users are sorted by upvote within each article page. This feature is a bit like:
    • a Wikipedia where each user can have their own version of each article
    • a Q&A website like Stack Overflow, where multiple people can give their views on a given topic, and the best ones are sorted by upvote. Except you don't need to wait for someone to ask first, and any topic goes, no matter how narrow or broad
    This feature makes it possible for readers to find better explanations of any topic created by other writers. And it allows writers to create an explanation in a place that readers might actually find it.
    Figure 1.
    Screenshot of the "Derivative" topic page
    . View it live at: ourbigbook.com/go/topic/derivative
  2. local editing: you can store all your personal knowledge base content locally in a plaintext markup format that can be edited locally and published either:
    This way you can be sure that even if OurBigBook.com were to go down one day (which we have no plans to do as it is quite cheap to host!), your content will still be perfectly readable as a static site.
    Figure 2.
    You can publish local OurBigBook lightweight markup files to either https://OurBigBook.com or as a static website
    .
    Figure 3.
    Visual Studio Code extension installation
    .
    Figure 4.
    Visual Studio Code extension tree navigation
    .
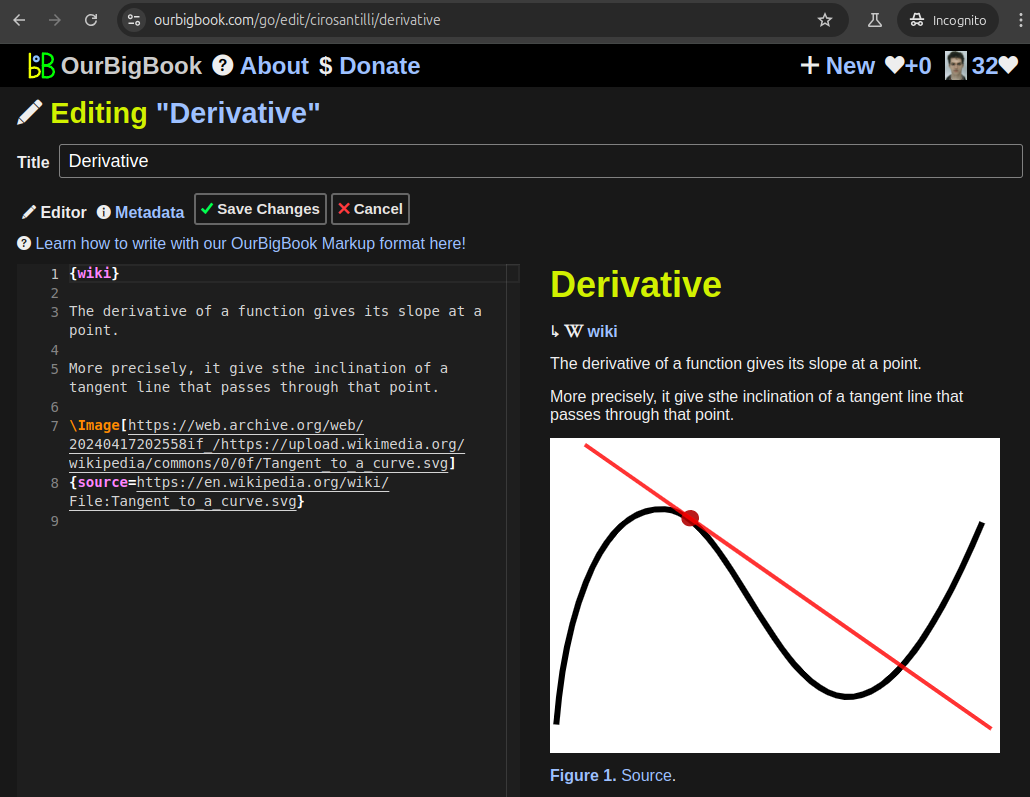
    Figure 5.
    Web editor
    . You can also edit articles on the Web editor without installing anything locally.
    Video 3.
    Edit locally and publish demo
    . Source. This shows editing OurBigBook Markup and publishing it using the Visual Studio Code extension.
    Video 4.
    OurBigBook Visual Studio Code extension editing and navigation demo
    . Source.
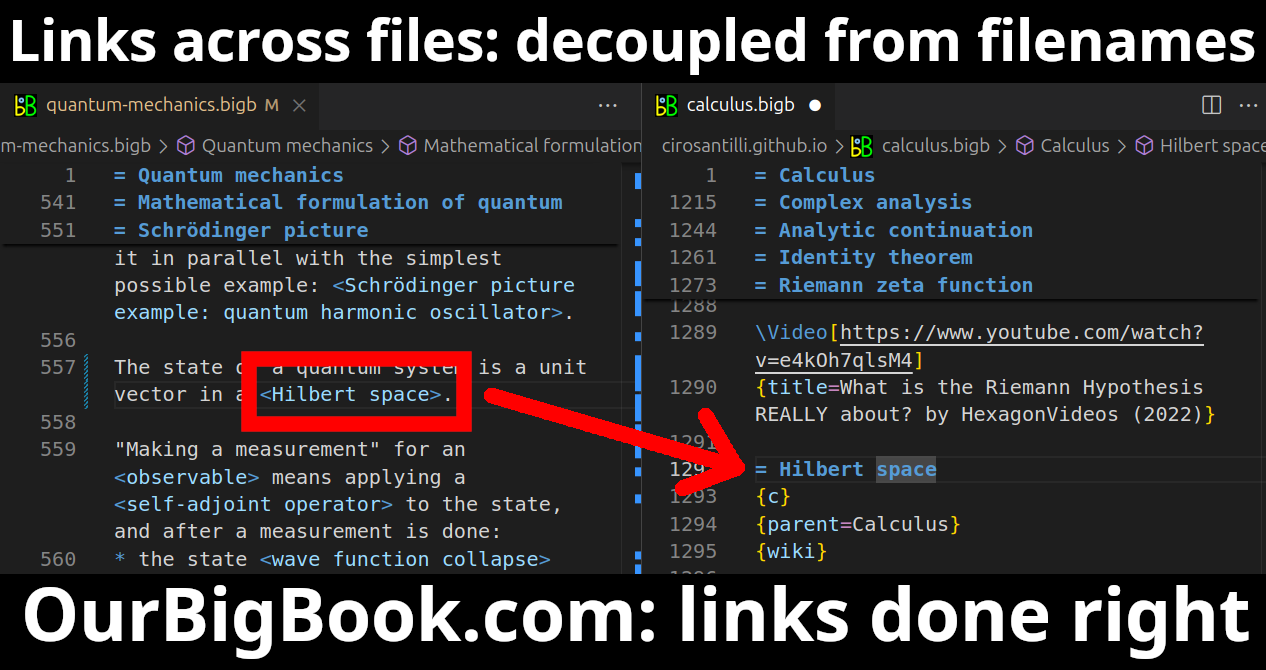
  3. https://raw.githubusercontent.com/ourbigbook/ourbigbook-media/master/feature/x/hilbert-space-arrow.png
  4. Infinitely deep tables of contents:
    Figure 6.
    Dynamic article tree with infinitely deep table of contents
    .
    Descendant pages can also show up as toplevel e.g.: ourbigbook.com/cirosantilli/chordate-subclade
All our software is open source and hosted at: github.com/ourbigbook/ourbigbook
Further documentation can be found at: docs.ourbigbook.com
Feel free to reach our to us for any help or suggestions: docs.ourbigbook.com/#contact